


Micron Stock Price Forecast: Down About 25% From June Record High, MU Risks Falling Below $900



Micron shares fell nearly 5% to close at $934.27, extending a 25% pullback from June highs, pressured by cooling AI memory momentum and Samsung’s earnings missing market expectations. Alphabet’s surging AI capital expenditures also triggered broader tech sector concerns regarding cloud capex sustainability. Despite medium-term fundamentals remaining supported by strong HBM demand, short-term technicals have weakened. The stock sits below its 20-day and 60-day moving averages, with the $960 to $970 range turning into overhead resistance. Key support lies at the psychological $900 level; a breach could risk a deeper adjustment toward $850 or $800.

TradingKey - Micron Technology (MU) stock came under pressure again, last closing at $934.27, down nearly 5% in a single day, with after-hours prices retreating further to around $903. Compared with the all-time high of about $1,250 set in June, the stock has pulled back about 25% cumulatively, as the strong upward structure previously driven by AI memory demand has cooled noticeably.
Previously, SK Hynix (SKHY)'s record quarterly results temporarily boosted memory stocks across the board, but Samsung Electronics subsequently posted net profit and semiconductor segment performance that failed to clear the market's rising expectation bar. Investors quickly exited memory chip stocks that had rallied significantly, leading Micron to give back part of its gains as well.
Although Samsung achieved a record quarterly operating profit, its semiconductor division profit fell slightly short of analysts' forecasts, with the gap between net profit and market consensus being even more pronounced. At the same time, the company failed to provide a new shareholder return plan that satisfied investors, contrasting with the large-scale dividend and buyback plans previously announced by SK Hynix. These results remind the market that even if memory prices and AI demand remain strong, corporate earnings can still deviate from expectations due to differences in execution, product mix, and capital allocation.
A broader tech stock adjustment also exacerbated selling pressure on Micron. Alphabet (GOOGL)'s earnings report revealed issues such as rapid growth in AI infrastructure investment, negative free cash flow, and elongated capital return cycles, leading investors to reassess whether cloud computing vendors can sustain expanding data center expenditures. Because Micron's demand for HBM, server DRAM, and enterprise storage is highly correlated with major cloud service providers' capital expenditures, market concerns over AI return on investment quickly transmitted across the entire memory supply chain.
However, the fundamentals of the memory industry have not experienced a clear reversal. SK Hynix expects that demand for AI servers, enterprise memory, and high-bandwidth memory (HBM) will sustain a supply shortage until 2030, and the company has already locked in over half of its planned capacity for 2027 to 2028 through long-term agreements. For Micron, increasing HBM shipments and tight DRAM supply continue to provide support for medium- to long-term profitability, even though the market is no longer willing to pay excessive premiums for long-term growth in the short term.
Source: TradingView
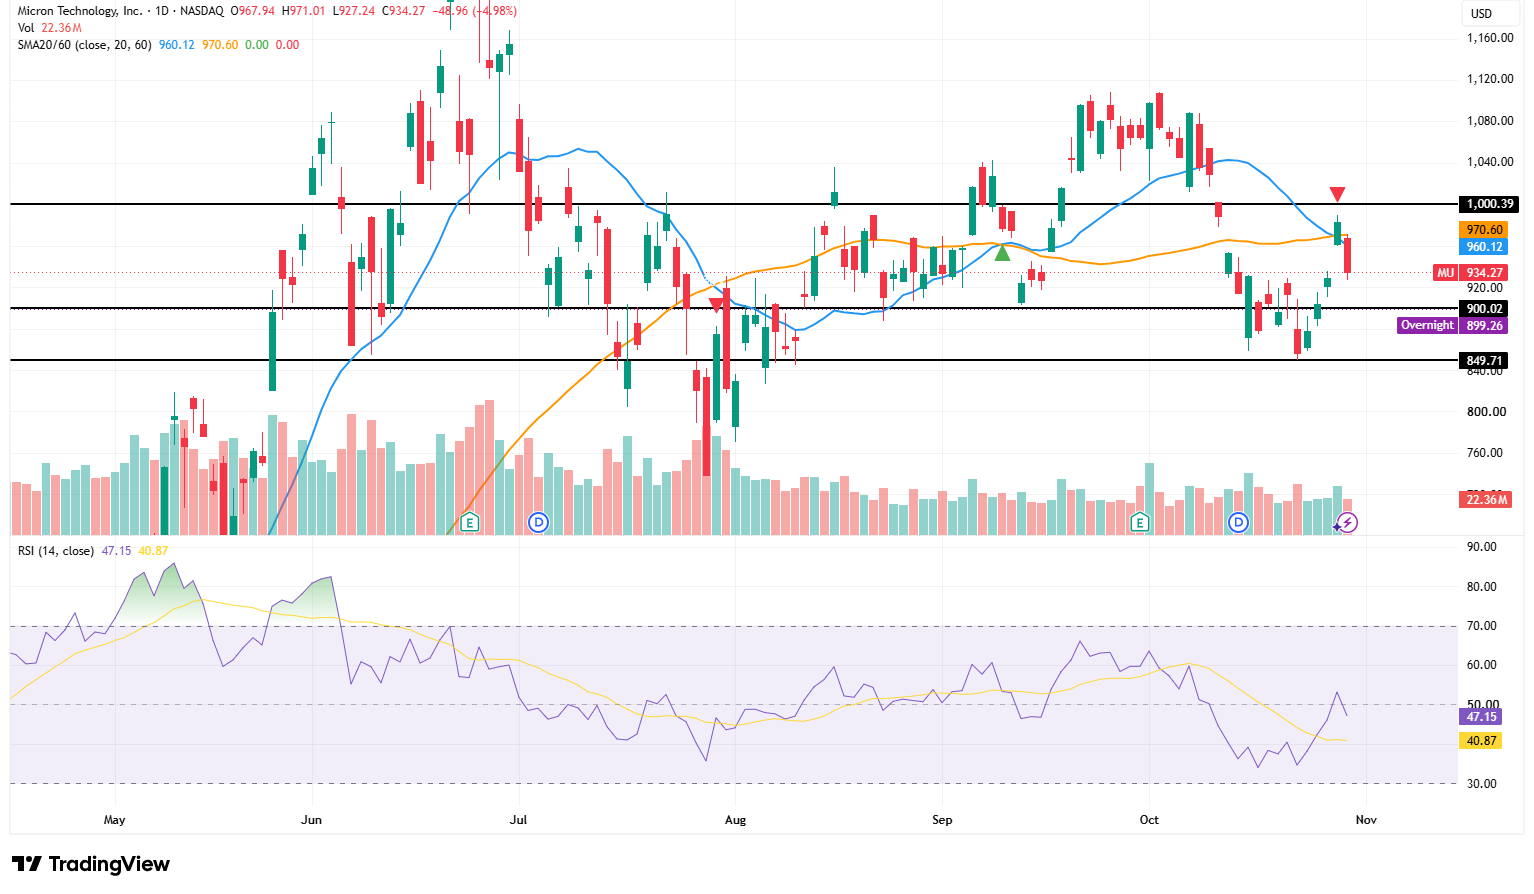
From a technical perspective, Micron's stock price has fallen below its 20-day moving average of $960.12 and 60-day moving average of $970.60, with the short-term structure weakening again. The two moving averages are concentrated between $960 and $971, turning this zone from previous support into resistance on bounces. Only by reclaiming $970 will MU have the opportunity to challenge the round number mark of $1,000 again; if it can firmly break above $1,000 on heavy volume, the next target could look toward the $1,050 to $1,100 region.
Momentum indicators also show that the stock price has not yet fully regained strength. The 14-day RSI stands at 47.15, which, although higher than its smoothed signal line of 40.87—indicating that previous oversold pressure has eased—remains below the 50 centerline, reflecting that bears temporarily hold the upper hand. That day, after surging to $971.01, the stock price pulled back rapidly and closed near its low, which also demonstrates heavy selling pressure around $960 to $970.
On the downside, attention should first be focused on the round $900 mark. This level is not only close to the after-hours price, but also serves as an important psychological line of defense for the recent consolidation range. If MU can hold $900 and reclaim $960 to $970 in subsequent trading, the current adjustment can still be regarded as range-bound fluctuation, and the stock price retains the possibility of returning to $1,000.
Conversely, if the stock price decisively breaks below $900 on a daily closing basis, the market may further test the previous low around $850. If $850 gives way again, the next stronger support level will shift down to $800. Calculated based on the closing price of $934.27, a drop to $800 corresponds to a potential downside of about 14%, implying that Micron could enter a deeper adjustment phase again.
This content was translated using AI and reviewed for clarity. It is for informational purposes only.
Recommended Articles










Comments (0)
Click the $ button, enter the symbol, and select to link a stock, ETF, or other ticker.