


Amazon Stock Forecast: AMZN Slides Toward $226.21 as Cash Burn Overshadows AWS's 39% Growth



AI Podcast


Amazon shares fell approximately 7% in premarket trading on Friday, October 30, following third-quarter results that missed consensus estimates for revenue and EPS. Despite AWS achieving its fastest growth in nearly five years with a 39% revenue increase, heavy capital expenditures for AI data centers caused trailing free cash flow to turn sharply negative to an outflow of $42.4 billion, funded by increased long-term debt. Technically, the stock breached key support levels, shifting momentum bearish. A daily close below the $226.21 support level targets further downside toward $216.22, while reclaiming $247.46 is required to invalidate the breakdown.

TradingKey - Amazon (NASDAQ: AMZN) fell to $226.10 in premarket trading on Friday, October 30, down about 7%, after its third-quarter report on Thursday, October 29. The stock had already dropped 4.25% to $243.79 in the regular session, so it now sits about 11% below Wednesday's close of $254.60.
AWS, Amazon's cloud business, grew at its fastest pace in nearly five years. But revenue and EPS came in slightly below estimates, and free cash flow, the cash left after capital spending, turned sharply negative as Amazon spends heavily on AI data centers.
Q3 Results: A Narrow Miss
Revenue rose 12% to $201.9 billion, just below the roughly $202.1 billion analysts expected. EPS was $1.89, short of the $1.96 estimate and down from $1.95 a year earlier, when results included a $9.5 billion pre-tax gain on Amazon's Anthropic stake. Operating income rose 61% to $28.1 billion, lifting the operating margin to 13.9% from 9.7%.
Amazon said moving Prime Day into Q2 in most large countries cut about 4 percentage points from Q3 sales growth.
AWS Had Its Fastest Growth in Nearly Five Years
AWS revenue rose 39% to $45.98 billion, and its operating income climbed 55% to $17.77 billion. CEO Andy Jassy said growth accelerated "for the sixth straight quarter, our fastest growth in nearly five years." At this pace, AWS brings in about $184 billion a year.
Jassy also said "AWS can grow north of 40% in each of 2027 and in 2028 and be a trillion-dollar revenue business in the next five to 10 years." Token volume on Bedrock, Amazon's AI model platform, grew nearly 17 times from a year earlier.
Retail and Ads Slowed
North America sales grew 6% to $112.9 billion with a 7.7% operating margin, and International sales rose 5%, or 8% excluding currency moves. Advertising grew 11% to $19.6 billion. CFO Brian Olsavsky said the Prime Day shift took about 8.5 percentage points off ad growth compared with Q2, and Jassy expects growth to return to the high teens in Q4.
Free Cash Flow Turned Deeply Negative
Amazon spent $77.3 billion on property and equipment in Q3, more than double the $35.1 billion a year earlier. Operating cash flow still rose 29% to $168.3 billion over the past 12 months, but trailing free cash flow swung to an outflow of $42.4 billion, from an outflow of $7.6 billion just one quarter earlier.
Borrowing is filling the gap. Long-term debt jumped to $173.1 billion from $65.6 billion at the end of 2025, while cash fell to $55.8 billion from $86.8 billion. Amazon kept its 2026 cash capex guide at about $220 billion, and Jassy said it expects to spend "meaningfully more in 2027."
Amazon Joins the Cash-Burning Side
That puts Amazon next to Alphabet, which posted negative free cash flow of $9.1 billion in Q3, and Meta, which priced $37.5 billion of new stock and preferred shares on October 27. Microsoft, by contrast, produced $18.6 billion of free cash flow and rose after its report. In my view, AWS is clearly earning a return, but investors now want proof that the spending turns into cash before they pay up.
Q4 Guidance and What to Watch
For Q4, Amazon guided sales to $240 billion to $247 billion, up 12% to 16%, and operating income to $28.5 billion to $33.5 billion, versus $25.0 billion a year earlier. The holiday quarter will be the first clean test of retail growth without the Prime Day distortion.
Amazon Technical Analysis: Daily Close Below $226.21 Could Open $216.22
The selloff shows clearly on the daily chart. AMZN broke below a triangle, a narrowing price pattern, and the $247.46 support zone during Thursday's session, ending weeks of sideways trading. It now trades below the 50-day and 100-day EMAs, moving averages that give more weight to recent prices, which sit near $252 to $254. Trading below both favors sellers.
RSI, a momentum gauge that runs from 0 to 100, has dropped to about 41, and the MACD, a trend-following momentum indicator, has turned slightly negative. Both show momentum shifting lower.
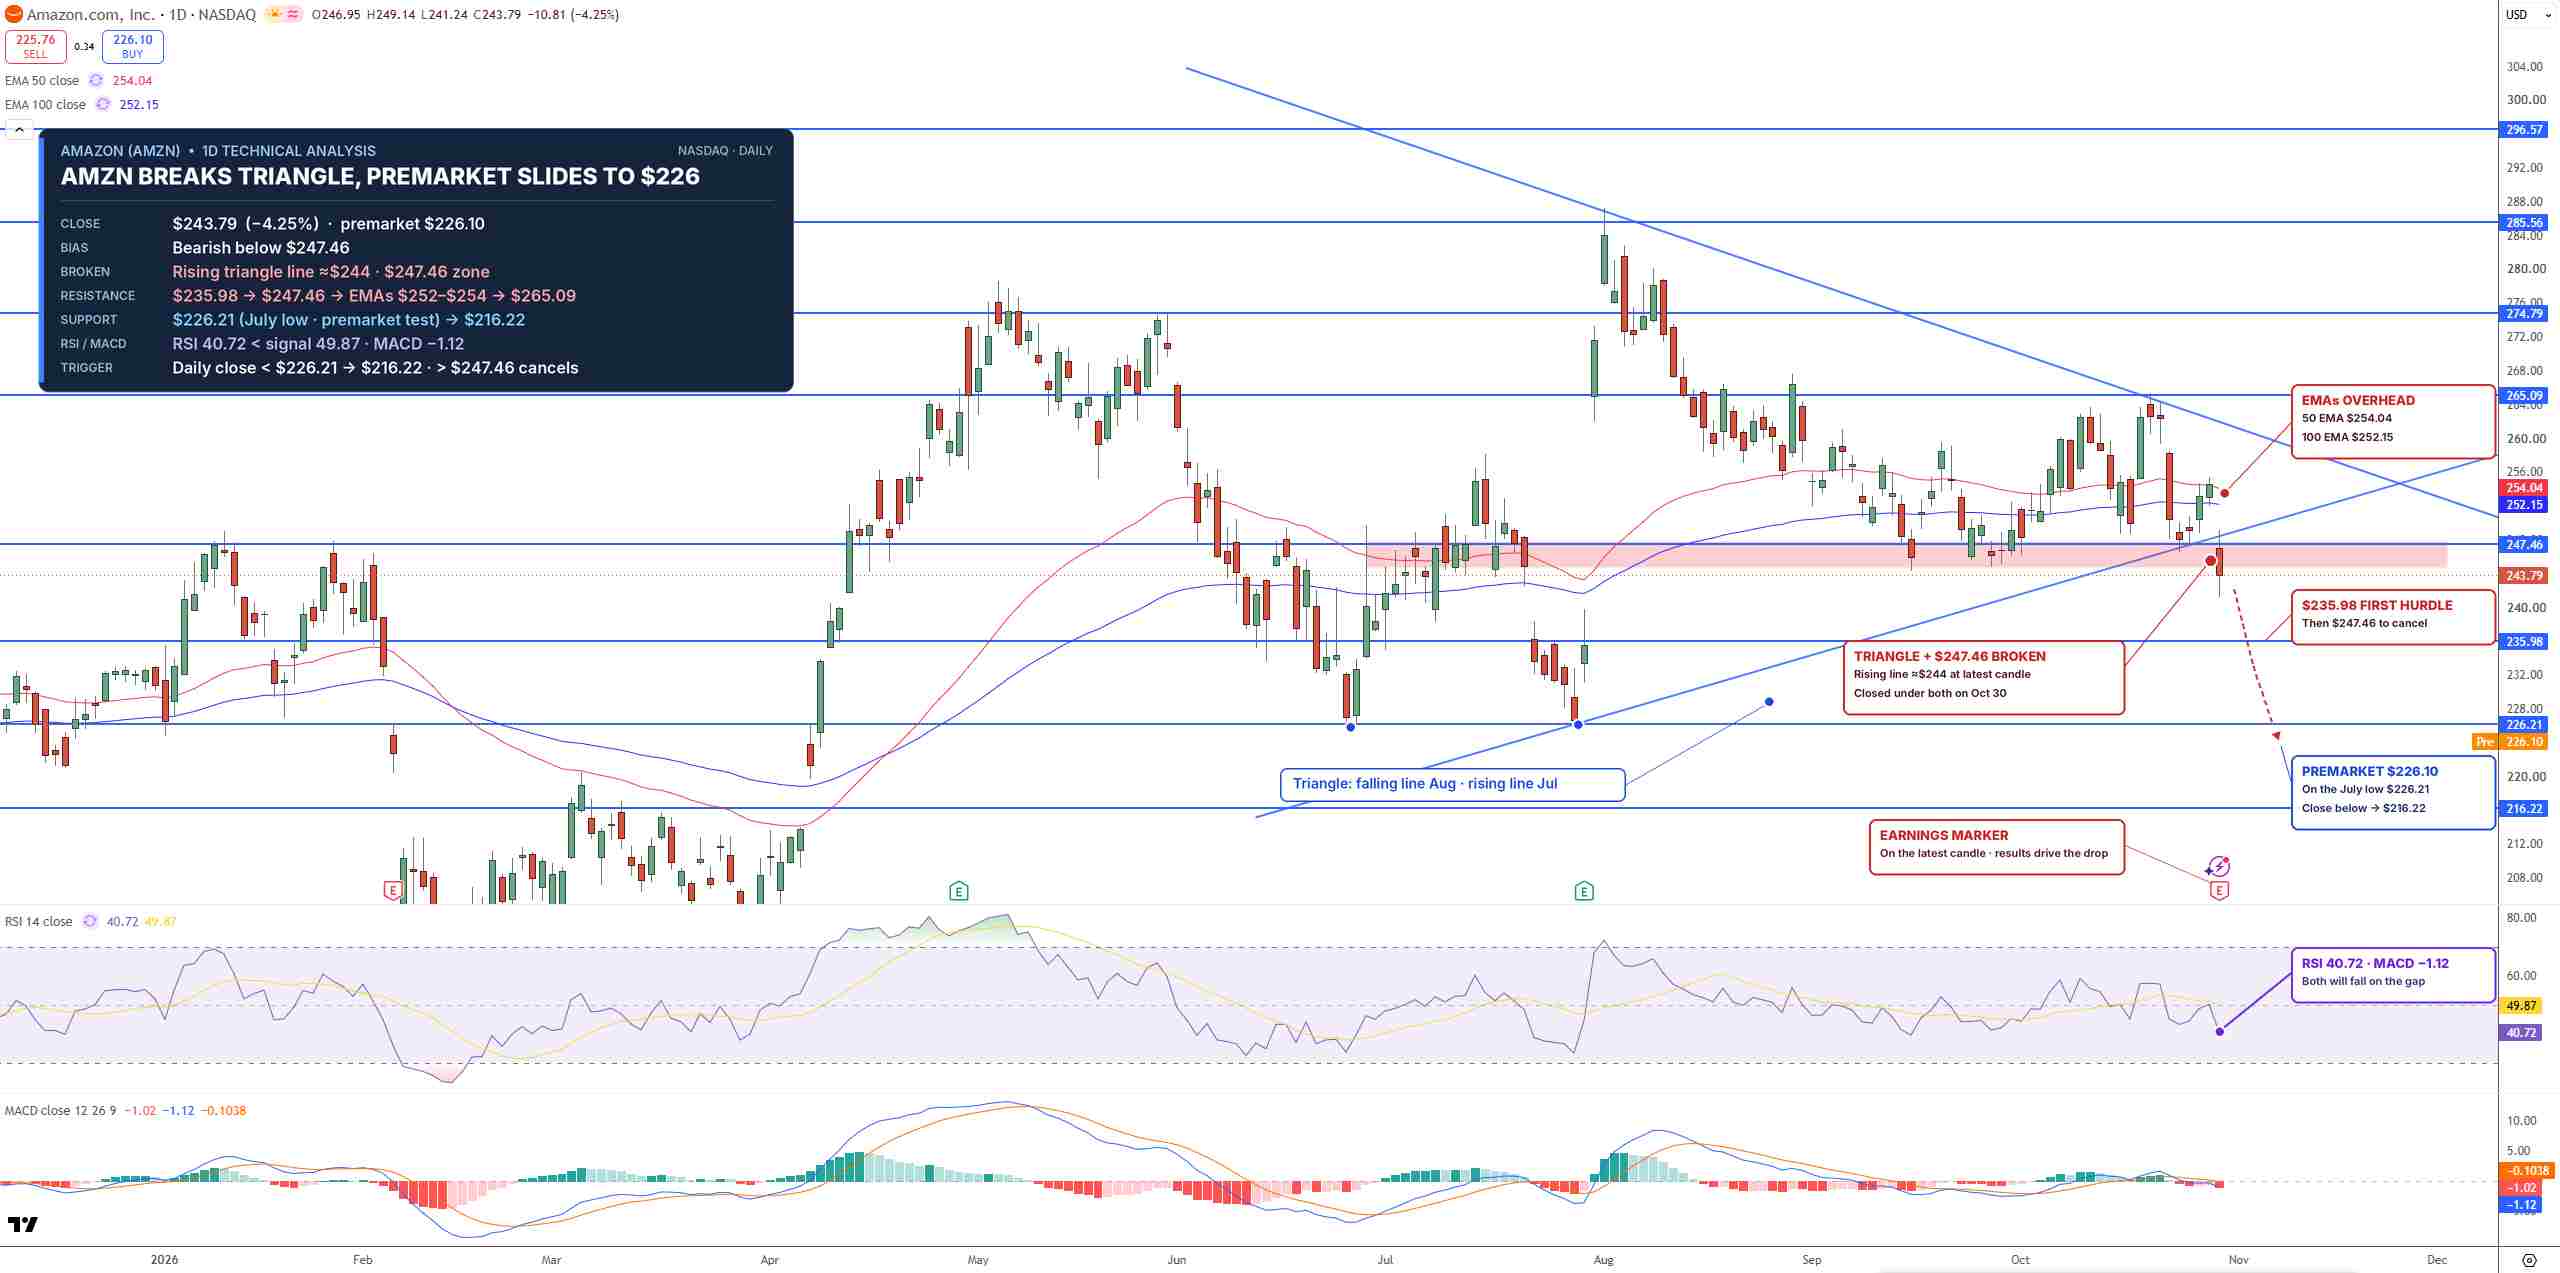
AMZN Price Chart - Source: Tradingview
The premarket price is testing $226.21, the July low, where buyers stopped the last decline. A daily close below it would open the way for $216.22. For buyers, a move back above $235.98 would ease the pressure, but AMZN needs to reclaim $247.46 to cancel the breakdown. That level has now turned into resistance, a price where selling tends to stop rallies.
I'm bearish while AMZN stays below $247.46, with $226.21 and $216.22 as the downside targets.
Key Levels
- Last close: $243.79, down 4.25% on October 29 (premarket: $226.10)
- Support: $226.21, $216.22
- Resistance: $235.98, $247.46, $252.15, $254.04
- RSI: 40.72, below the 50 midline
- Bullish trigger: Daily close above $247.46
- Bearish trigger: Daily close below $226.21
FAQs
Why did Amazon stock fall after earnings?
Amazon fell about 7% in premarket trading after revenue and EPS came in slightly below estimates and trailing free cash flow swung to an outflow of $42.4 billion, outweighing AWS's 39% growth.
What is the Amazon stock forecast now?
The bias is bearish below $247.46 on the daily chart. A daily close below $226.21 would open $216.22, while a move back above $235.98 would ease the pressure.
Bottom Line
AWS is growing faster than it has in nearly five years, but Amazon is now borrowing to fund the AI buildout, and investors are marking the stock down for it. The level that matters is $226.21, the July low the premarket price is testing. I'd expect a daily close below it to open $216.22, and only a move back above $247.46 would cancel the breakdown.
Recommended Articles










Comments (0)
Click the $ button, enter the symbol, and select to link a stock, ETF, or other ticker.