


Oracle Stock Forecast: Retreats After Post-Earnings Surge, Breaches $150 and May Drop to $115



AI Podcast


Oracle stock has experienced a significant pullback from its September high, erasing short-term gains and breaking below key moving averages. Despite strong AI orders and OCI growth highlighted in recent earnings, price action displays a bearish downward trajectory with lower highs and lower lows. The primary downside support stands near $137, with deeper risk toward $115 and $100 if breached. Conversely, overhead resistance remains at the $150 gap level; reclaiming this threshold is essential for a potential rebound toward $170 and a subsequent test of $200. Short-term bearish momentum currently dominates the market outlook.

TradingKey - Oracle (ORCL) stock price has weakened noticeably recently. Following the latest earnings release, ORCL surged after-hours driven by rapid OCI growth and strong AI orders, but quickly pulled back after opening higher above $164 on September 11. On September 14, it fell a further 3.65%, losing the $150 level to close at $144.79, touching an intraday low of $141.01. Compared to its interim high of $170.70 on September 8, short-term gains have been largely erased.
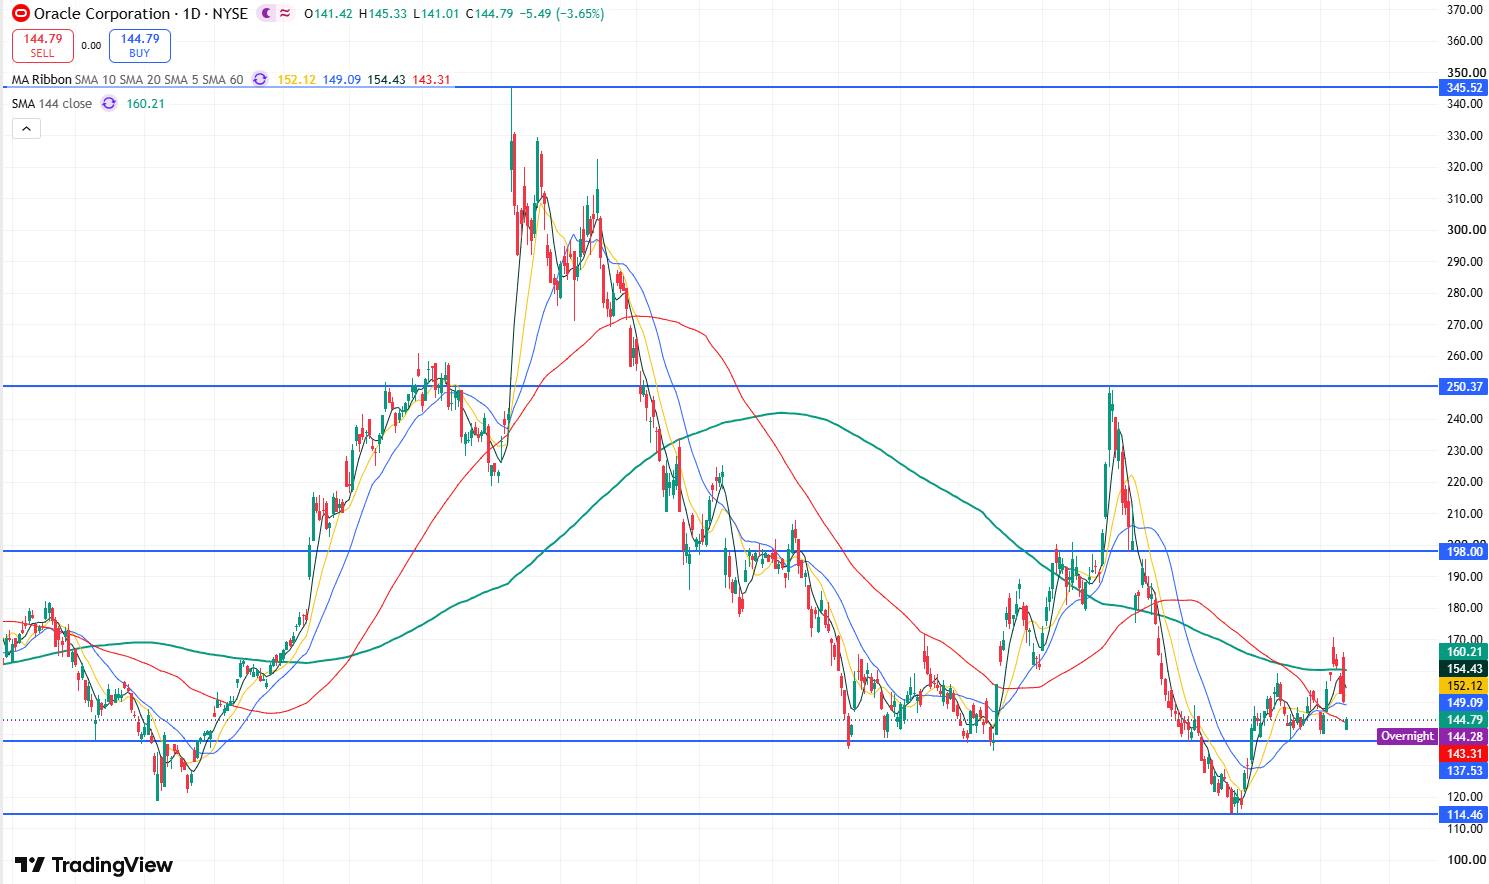
Oracle daily stock price chart, Source: TradingView
Looking at the daily chart of Oracle's stock price, the overall price action since September 2025 exhibits a clear pattern of lower highs and lower lows, indicating that the overall stock price trend remains in a downward trajectory.
In terms of recent price action, although the stock rallied to $166 last Friday, it reversed gains on the same day to close down 1.74%, driving market sentiment back to bearish.
Currently, the stock has consecutively broken below its 5-day, 10-day, 20-day, and 60-day moving averages, further strengthening bearish momentum and suggesting that short-term price weakness may persist.
To the downside, the primary support level to watch is near $137. If this level fails to hold, the stock may further test the July low near $115. If broken, it could open up deeper downside room, potentially falling toward the $100 mark.
To the upside, the primary resistance level to monitor is near Monday's gap down at $150. If the stock can hold above $150, it will open up room for a rebound toward $170. A breakthrough above $170 could potentially set the stage to test the $200 level.
This content was translated using AI and reviewed for clarity. It is for informational purposes only.
Recommended Articles












Comments (0)
Click the $ button, enter the symbol, and select to link a stock, ETF, or other ticker.