


Western Digital Stock Price Forecast: Jumps Nearly 6% Against the Trend, Can WDC Reclaim $600?



AI Podcast


On September 4, U.S. storage stocks rallied against broader market declines, led by Western Digital’s 5.86% surge to $467.46. Technical indicators show strong support at the 144-day moving average, signaling a potential short-term bottom and increased bullish momentum. Primary upside resistance is identified at the $500–$519 gap, with subsequent targets at $548.60 and $600 upon breakout. Conversely, downside risks include immediate support at $400–$420, with deeper correction risks targeting the $357 Fibonacci level and $300–$320 range if support fails.

TradingKey - Last Friday (September 4), U.S. stocks fell overall, but the storage sector bucked the trend and gained, with Western Digital (WDC) rising 5.86% to close at $467.46, after hitting an intraday high of $468.19. SanDisk (SNDK), Micron (MU), Seagate (STX), and other storage stocks advanced in tandem, indicating short-term relative strength in the storage sector.
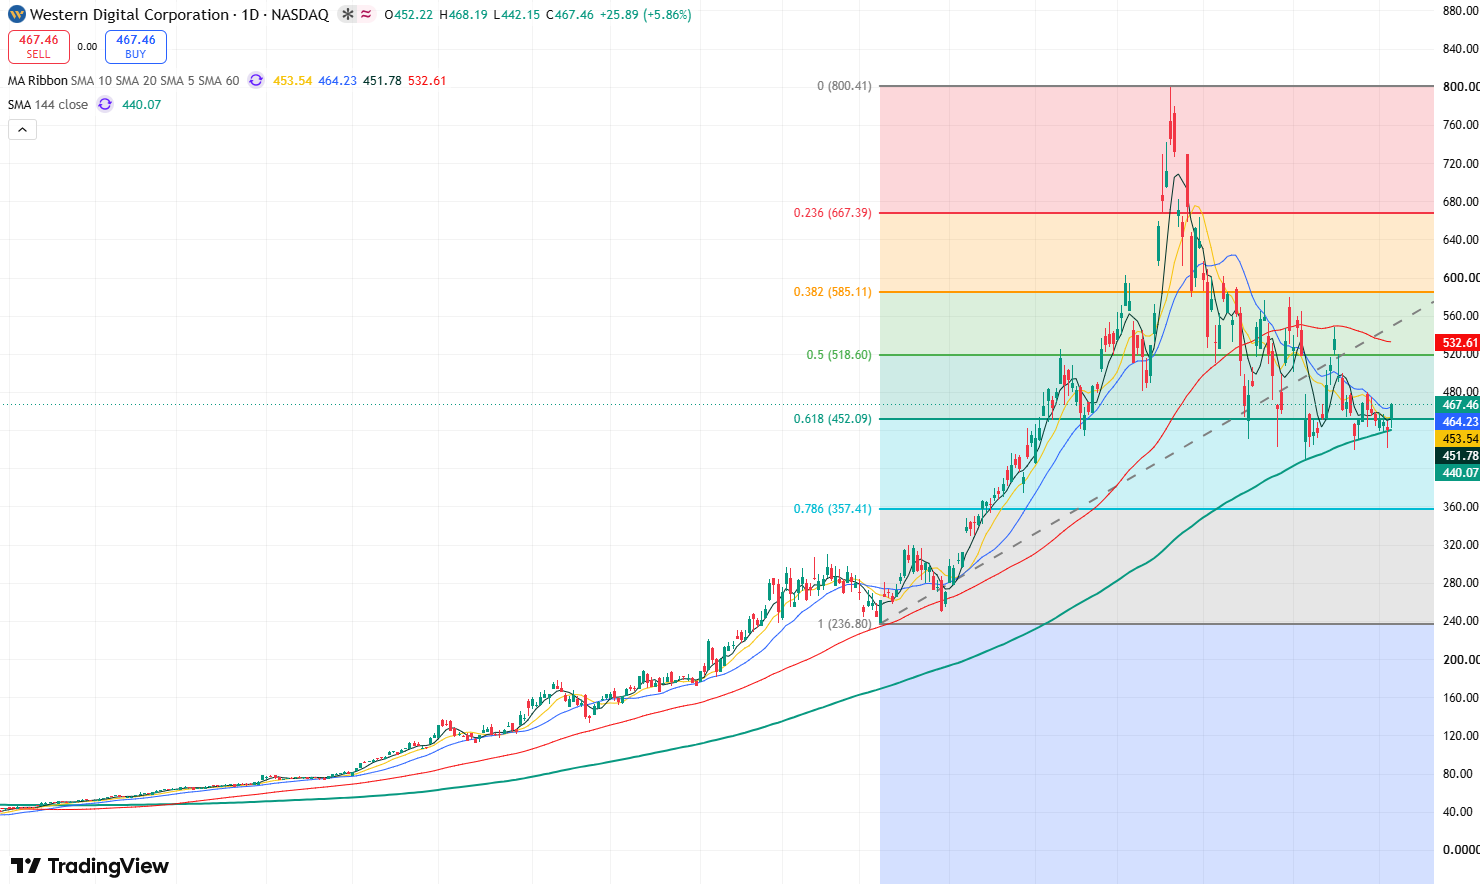
Western Digital daily stock price chart, Source: TradingView
From the daily chart of Western Digital's stock price, the stock has recently tested the 144-day moving average three consecutive times, with the closing price remaining above it each time, indicating strong support at this moving average. A short-term bottom for the stock may have formed, and last Friday's 5.86% surge above the 144-day moving average further strengthened the market's bullish momentum.
Currently, the primary resistance level above is the gap between $500 and $519. If the stock fills this gap and continues to rise, the next target will be to challenge the August 17 rebound high of $548.60. If the stock can break through and hold above this level, it will open up upside potential toward the $600 mark.
On the downside, the primary support level below is in the $400–$420 range. If the stock drops below $400, it may enter a deeper pullback phase in the short term, potentially falling toward the 0.786 Fibonacci retracement level near $357. Further down, support in the $300–$320 range should be watched.
This content was translated using AI and reviewed for clarity. It is for informational purposes only.
Recommended Articles












Comments (0)
Click the $ button, enter the symbol, and select to link a stock, ETF, or other ticker.