


Crude Oil Price Forecast: Escalating US-Iran Tanker Attacks and Strait of Hormuz Risks Push Brent to $120?



AI Podcast


International oil prices extended gains as U.S.-Iran military confrontations in the Strait of Hormuz heightened supply disruption fears. Brent crude rose 1.47% to $97.25 a barrel, and WTI gained 1.09% to $92.23. Commercial vessel transits dropped to their lowest since May, fueling market volatility. Goldman Sachs warns that escalating conflicts could push Brent crude to $120 per barrel, while a normalization of exports might retrace prices toward $80. Technically, Brent’s break above key moving averages sustains a bullish short-term outlook, with immediate support at $94.93 and major resistance clustered between $100 and $100.80.
TradingKey - International oil prices continued to climb on Monday, extending their strong performance from the previous week.
As military confrontations between the U.S. and Iran heat up again in and around the Strait of Hormuz, market concerns over energy transport disruptions have expanded rapidly, making crude oil supply risks the primary factor influencing price trends once again.
In Monday's trading, Brent crude futures rose 1.47% to $97.25 a barrel, while WTI crude futures gained 1.09% to $92.23 a barrel. In the prior week, Brent rose 7.8% cumulatively and WTI gained nearly 10%, lifting both global oil benchmarks to their highest levels since July.
Strait of Hormuz Traffic Over Past 10 Days Drops to Lowest Since May Amid Frequent Attacks
The US-Iran military conflict continues to spill over into maritime energy transport, with shipping activity in the Strait of Hormuz noticeably affected.
The US military stated that US forces attacked three Iranian oil tankers last Saturday, after Iran previously launched ballistic missiles at US Navy vessels. Iran subsequently took countermeasures, warning that Tehran will further intensify its response if the US continues to expand military operations.
Meanwhile, Iran is considering expanding its control over the waters around the Strait of Hormuz. Rezaei, Secretary of Iran's Supreme National Security Council, stated that new maritime restricted zones will be announced in the coming days, and vessels entering these waters could face sanctions. The US, meanwhile, continues to enforce a maritime blockade and has deployed over 20 warships, which has already led some commercial vessels to reroute.
Signs of shipping disruptions are already glaringly evident. Data from ship-tracking firm Kpler shows that as of September 6, an average of only 10 commercial vessels per day passed through the Strait of Hormuz over the past 10 days, the lowest level since May. The 10-day moving average transit volume also fell from 15 vessels last Friday to 10 on Sunday, with only 6 vessels actually passing through on Sunday, most of which were Iranian vessels.
Notably, on Sunday, only three bulk carriers carrying metals, grains, or oilseeds and one VLCC entered the strait, while not a single VLCC successfully transited out of the Strait of Hormuz over at least the past three days.
Goldman Sachs Warns Oil Prices Could Rise to $120
As the risk of supply disruptions rises, Goldman Sachs (GS) has significantly heightened its focus on oil prices under extreme scenarios.
Daan Struyven, co-head of Global Commodities Research at Goldman Sachs, stated that a recent series of events indicates an increasing risk of Middle East shipping disruptions. If attacks on commercial vessels escalate further, Brent crude could experience a more dramatic surge.
In Goldman Sachs' upside scenario, Brent crude prices could reach $120 per barrel. Based on the current price of around $97, this implies potential further upside of over $20 for oil prices.
However, $120 is not Goldman Sachs' baseline forecast, but is instead built on a scenario where shipping disruptions continue to worsen and supply faces a more severe shock. If Middle East exports and shipping return to normal and the risk premium fades, oil prices could pull back toward $80 per barrel.
Goldman Sachs also advised investors to monitor energy commodities such as natural gas and diesel. The bank believes that under shipping disruptions, the supply shock to refined products and natural gas markets could be even more pronounced, potentially leading to price performance that outpaces crude oil.
Crude Oil Price Technical Analysis
Source: TradingView
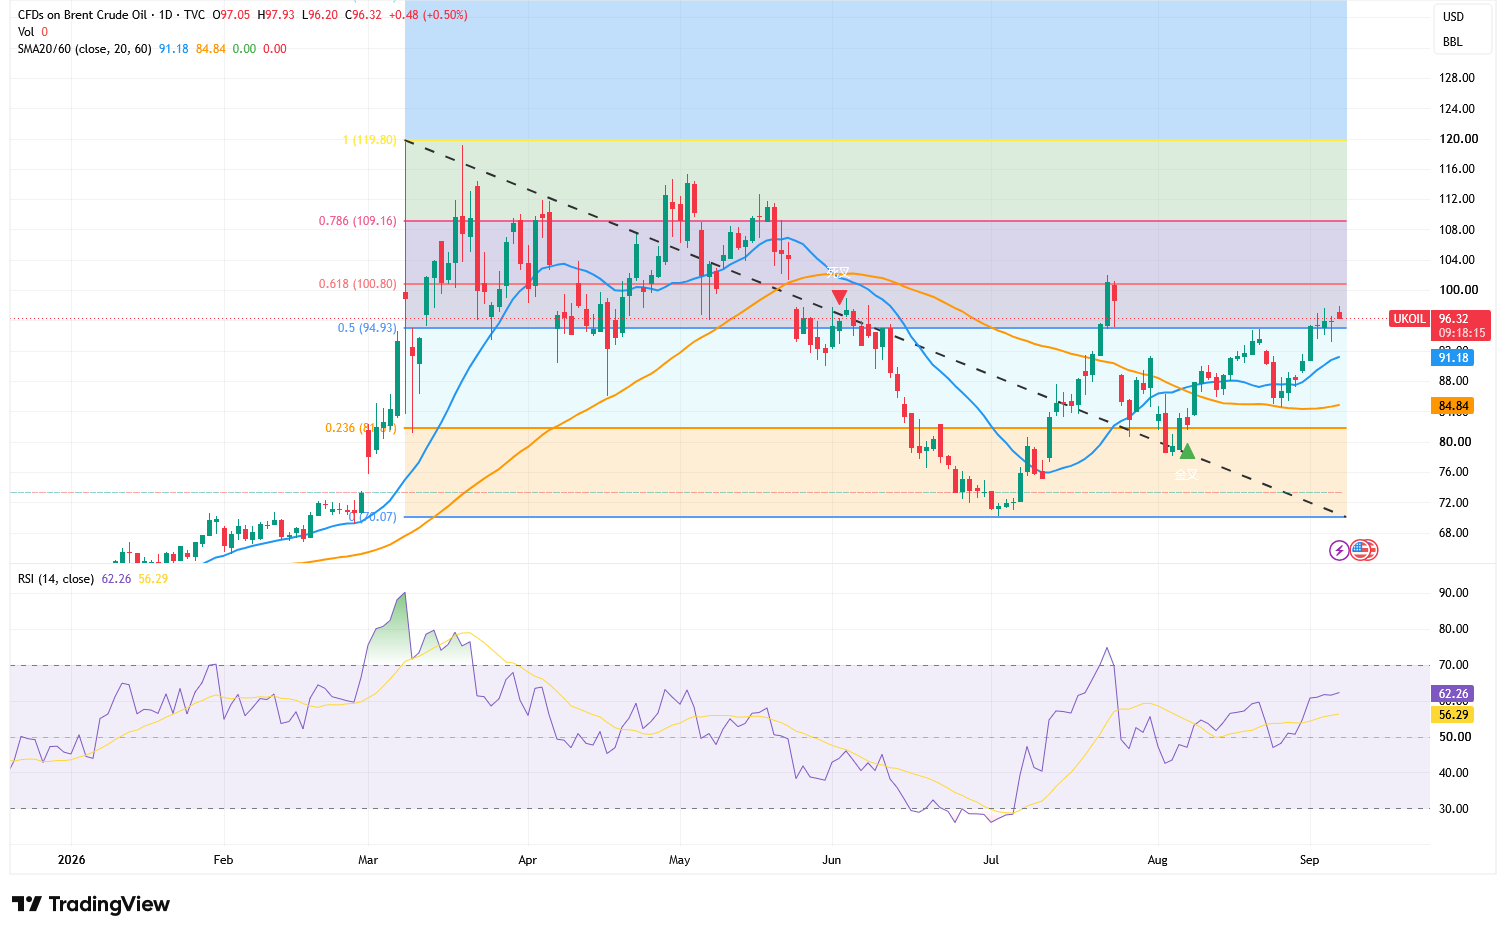
Looking at the daily chart, Brent crude has broken above the previously formed downtrend line and reclaimed both the 20-day moving average at $91.18 and the 60-day moving average at $84.84. The 20-day moving average has begun turning upward, and the price structure has shifted from a low-level rebound to a bullish stance, indicating that the short-term uptrend remains intact.
The RSI currently stands at around 62.26, above its signal line at 56.29 and the 50 neutral threshold, reflecting strengthening buying momentum. Meanwhile, it has not yet entered the overbought territory above 70, suggesting oil prices still have room for further upside.
Currently, the primary level to watch is $94.93, which corresponds to the 0.5 Fibonacci level; Brent crude holding firmly above this mark would indicate a further improvement in the rebound structure. The first major resistance above is concentrated between $100 and $100.80. If a valid daily breakout occurs, the next target could be $109.16. Only a further breakthrough above $109 would set the stage for oil prices to retest previous highs of $119.80 to $120.
To the downside, support is found first at $94.93, followed by the 20-day moving average at $91.18. As long as prices remain above $91, the short-term trend stays bullish; if it falls below $91, oil prices may retest $88 to $89. The 60-day moving average at $84.84 and the $81.81 Fibonacci level form a more crucial medium-term support zone, and a drop below this region would significantly weaken the current upward structure.
This content was translated using AI and reviewed for clarity. It is for informational purposes only.
Recommended Articles












Comments (0)
Click the $ button, enter the symbol, and select to link a stock, ETF, or other ticker.