


SanDisk Stock Price Forecast: SNDK Surges 12% Against the Trend as US Stocks Fall, Stock Could Reach $2,000



AI Podcast


U.S. stocks declined last Friday due to strong nonfarm payrolls driving Fed rate hike concerns. Conversely, the memory chip sector surged, led by SanDisk jumping 11.9% to $1,740. SanDisk’s technical structure improved significantly, forming an inverse head-and-shoulders pattern with heavy volume. The stock exhibits strong bullish momentum, targeting an initial resistance test at $1,827.99, with potential upside toward $2,000 and its all-time high of $2,354.39. Downside support rests in the $1,417-$1,400 range, where a break below risks further declines toward $1,275.

TradingKey - U.S. stocks weakened overall last Friday as strong nonfarm payrolls data fueled Fed rate hike expectations, sending the S&P 500 down 0.4% and the Nasdaq down 0.3%. However, the memory chip sector bucked the trend to become one of the market's strongest segments, with the Roundhill Memory ETF surging 6.61% and SanDisk (SNDK) jumping 11.90% to $1,740, making it the best-performing stock in the S&P 500 that day; Micron (MU), Western Digital (WDC), and Seagate Technology (STX) all gained around 6%.
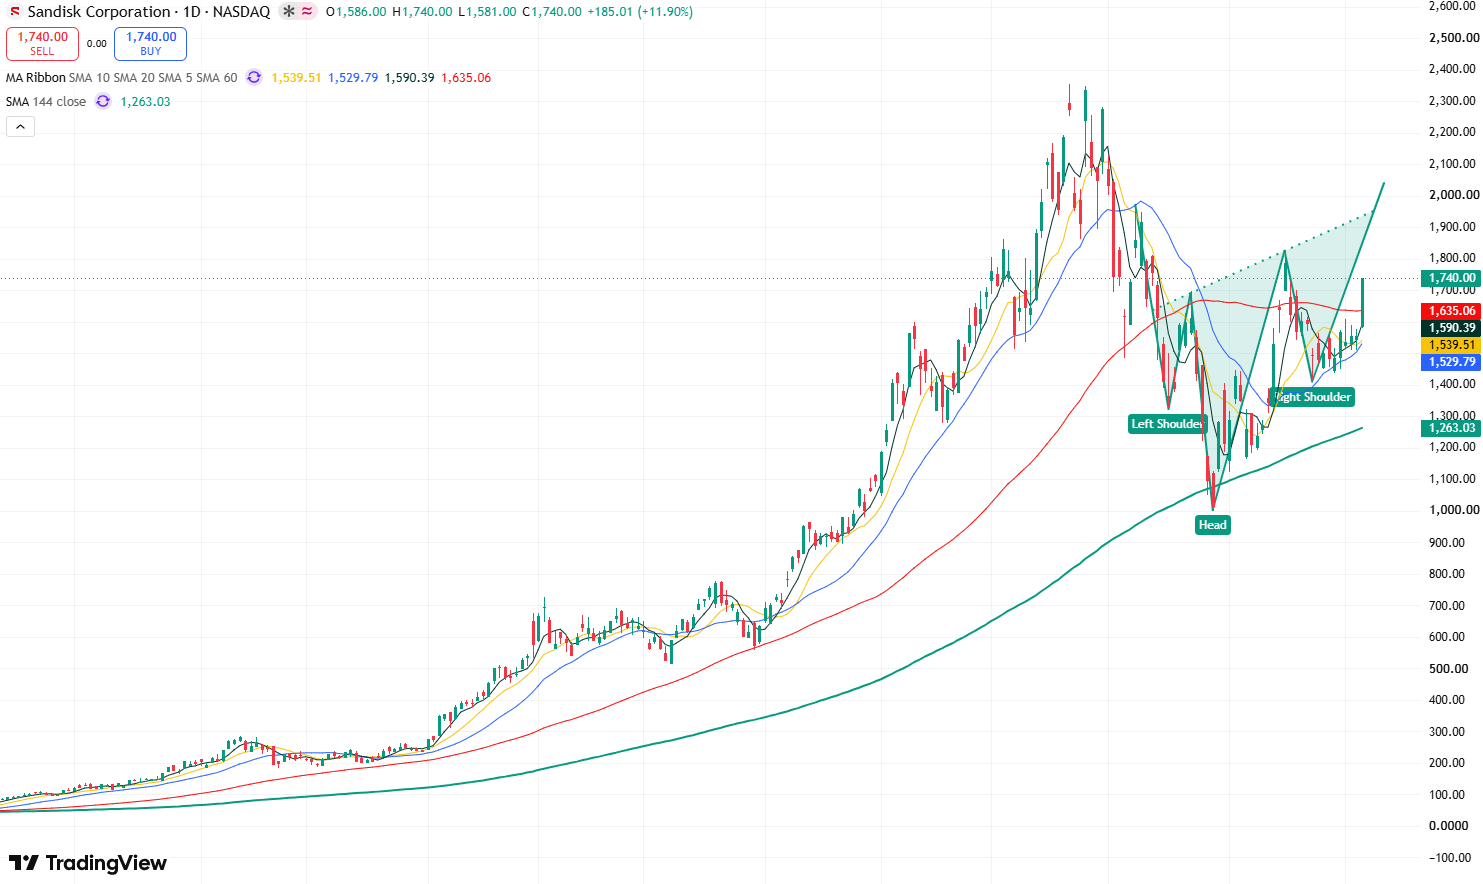
SanDisk daily stock price chart, Source: TradingView
Looking at SanDisk's daily stock price chart, last Friday's sharp rally significantly improved its short-term structure. The stock price has continued to rebound from an interim low of $1,416.56 on August 24, surging further on heavy volume to $1,740 last Friday, reapproaching the previous high zone formed in mid-August. Notably, despite the overall decline in U.S. stocks, SanDisk still closed near its intraday high, demonstrating strong short-term buying momentum.
Meanwhile, SanDisk's candlestick pattern has formed an inverse head-and-shoulders structure, significantly strengthening bullish market momentum. The stock may sustain its upward trend in the short term, with an initial target testing the recent high of $1,827.99. A breakout above this level would open up upside room toward the $2,000 mark, with potential to further test its all-time high of $2,354.39.
On the downside, initial support below is in the $1,417-$1,400 range. If the stock falls below $1,400, it may test the support level at $1,325. If this level is lost, the stock could further test the $1,275-$1,300 range.
This content was translated using AI and reviewed for clarity. It is for informational purposes only.
Recommended Articles












Comments (0)
Click the $ button, enter the symbol, and select to link a stock, ETF, or other ticker.