


Nike: Just Bounce It — Shares Hit 12-Year Low, Will the Market Jump the Gun?



AI Podcast


Nike faces a critical turnaround phase following a steep stock decline, with short-term revenue expected to drop as the company aggressively cuts classic inventory and curbs promotions. While consumer demand and regional recovery in China remain unproven, operational improvements in inventory turnover, reduced discounting, and expanding gross margins could drive profit recovery ahead of top-line growth. Management aims to restore health by balancing direct-to-consumer and wholesale channels while reinvesting in performance and new product categories. Although downside risks persist, the risk-reward profile is skewed upward, with FY2027 focusing on margin validation and FY2028 targeting sustainable growth.
From Selling Less and Discounting Less to Reworking New Products: Nike Has Yet to Complete Turnaround, but Stock May Not Wait for Earnings to Fully Recover
Nike's revenue may continue to decline in the short term, but discounts, inventory turnover, and margins have a chance to improve first. As long as these changes emerge sequentially, convincing the market that the worst is passing, the stock price could rebound ahead of a noticeable recovery in company profits.
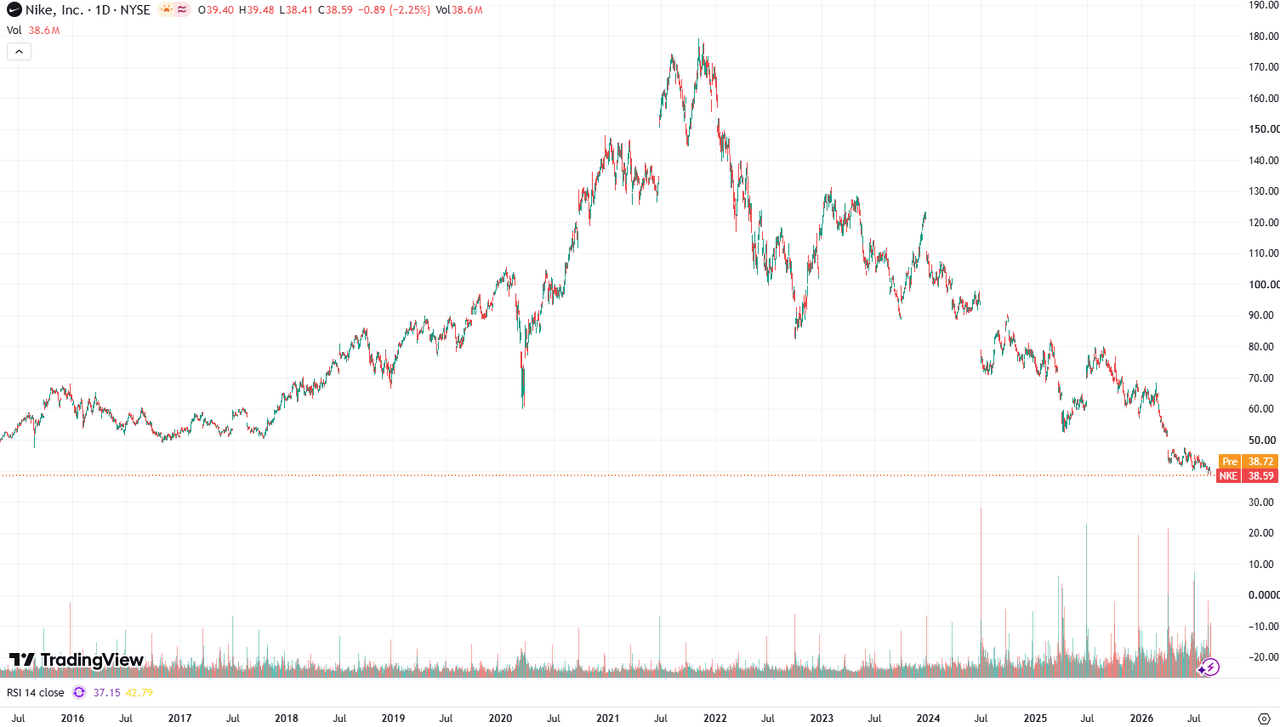
This is also what makes Nike most worthy of study after falling to a 12-year low. On August 17, the company's stock price hit its lowest closing price since 2014; as of August 28, the stock stood at $39.60, with a market capitalization of approximately $58.7 billion, down nearly 80% from its all-time high in 2021. The market is not worried about whether Nike will disappear, but whether it can once again create products consumers are willing to buy at full price and earn back the profits eroded by discounts, high costs, and product missteps.
Source: TradingView
Nike's fiscal year 2027 runs from June 2026 to May 2027. This year will first test whether promotions can be reduced, whether inventory turnover can remain stable or improve, and whether gross margins can expand; new shoe models, localized products in China, and revenue recovery will take longer. Management expects Q1 FY2027 revenue to remain down in the low-to-mid single digits, but gross margins to expand slightly year-over-year, while a dozen or so new Sportswear shoe models—a footwear and apparel category Nike classifies as casual wear rather than professional performance gear—will be concentrated in the second half of the year.
The market will not wait until all results show up in financial reports. As long as promotions, inventory turnover, and gross margins continue to improve, investors may raise profit expectations for the next two to three years in advance. However, Nike can currently only prove that the company has begun repairing itself, not that consumers have returned. What needs to be evaluated next is whether these actions can successively translate into fewer discounts, repeat reorders, and revenue recovery.
The market is not worried that Nike will disappear, but whether consumers are still willing to pay full price
The macroeconomic environment can explain why the athletic footwear industry has become tougher, but it cannot explain why Nike has been weaker than some of its peers. On's revenue in Q2 2026 grew 21.6% constant currency; HOKA grew 15.9% in FY2026 and continued to grow 7.7% in the following quarter. This does not prove they stole Nike's global market share one-for-one, but it shows consumers have not stopped buying sneakers—they are simply more willing to spend money on products with clear functionality, fresh design, or professional branding.
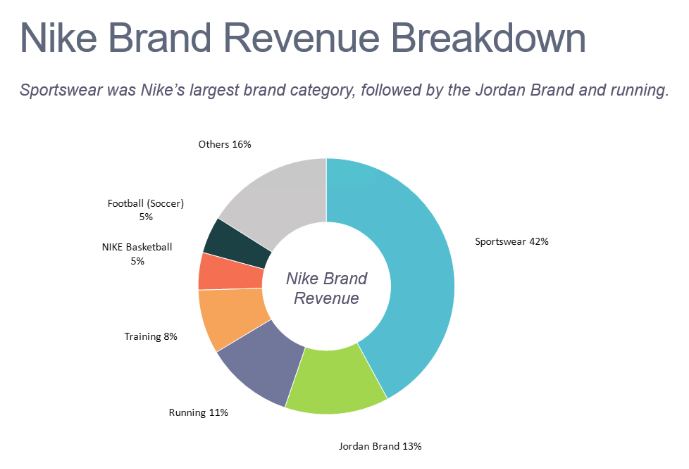
The portion that macro factors cannot explain falls first on Nike's own product structure. Nike Inc. refers to the listed entity as a whole; in financial disclosures, the Nike Brand includes Jordan's operating results, but excludes Converse, which is disclosed separately. In FY2026, Nike Inc. generated revenue of $46.4 billion, with the Nike Brand contributing $45.2 billion and footwear revenue accounting for about $29.5 billion. The main brand's footwear product cycle almost dictates the direction of the entire company.
Source: mekkographics
Nike's past problem was not a lack of growth strategies, but rather that several strategies effective in the short term simultaneously overextended the future.
Area | Past Strategy | Why It Worked in the Short Term | Why It Ultimately Failed | Current Adjustment |
Product | Expanding supply of Air Force 1, Dunk, and Jordan classic models | Classics had high brand awareness, making it easy to maintain sales volumes | Over-supply reduced scarcity, increased discounting, and led to inventory accumulation of older models | Proactively reducing classic models and introducing new silhouettes |
Channels | Increasing direct-to-consumer (DTC) share and reducing reliance on wholesalers | Theoretically higher gross margins per unit and direct access to consumer data | Nike absorbed more costs related to warehousing, delivery, returns, and inventory liquidation | Restoring the division of labor between direct-to-consumer and wholesale channels |
China | Replicating global product and marketing strategies locally | Large scale and unified execution | Insufficient product relevance and slow market responsiveness | Establishing local product teams and streamlining online channels |
Costs | Building fixed infrastructure for direct sales and digital businesses | Supported growth expectations at the time | Fixed costs failed to contract proportionately when sales declined | Streamlining warehousing, staffing, and logistics pathways |
Source: Nike FY2026 10-K, shareholder letter, and Q4 earnings call.
Product issues were the starting point of the entire chain. Because Air Force 1, Dunk, and certain Jordan retro models sold easily, Nike continually expanded supply. While short-term revenue was maintained, products became ubiquitous, and consumers no longer felt the urgency to buy today. In FY2026, the company proactively cut over $2 billion in revenue from classic styles, while Jordan sales dropped from $8.7 billion in FY2024 to $7.0 billion. As legacy products phased out before new products fully took over, revenue declines became a necessary part of the recovery process.
Once products lost their freshness, the DTC-first strategy amplified the problem. Direct-to-Consumer (DTC) refers to Nike selling products directly to consumers via its official website, apps, and owned stores; Nike groups these channels as Nike Direct in financial reports. While DTC eliminates retailer revenue cuts, it forces Nike to bear store, tech platform, warehousing, shipping, and return costs itself, while also reducing the try-ons, shelf exposure, and professional endorsements provided by Foot Locker, Dick's, and specialty running stores.
Channel data has already proven that the old logic of 'higher DTC share is always better' no longer works. In FY2026, Nike Brand wholesale revenue rose 4% constant currency, while Nike Direct fell 8%, with digital channels declining 12%. This does not mean Nike should pull back completely to wholesale, but rather that the two channels need a clear division of labor: DTC is suited for member relationships, exclusive products, and brand experiences, while retail partners handle product discovery, professional brand positioning, and volume sales.
Channel imbalance was most severe in China. From FY2024 to FY2026, Greater China revenue dropped from $7.545 billion to $5.847 billion, and EBIT fell from $2.309 billion to $1.278 billion; revenue declined about 23%, while profits plummeted about 45%. In FY2026, Chinese digital channel revenue fell another 29% constant currency, reflecting simultaneous pressure on promotions, channel efficiency, and fixed costs.
The Chinese market exposed the limitations of Nike's old model in a concentrated manner: global brand influence does not mean global products can be copied indiscriminately, nor does having more online sellers equate to a healthier sales network. Nike has acknowledged that the local digital marketplace was overly fragmented and plans to make its official flagship stores on Tmall, JD.com, and Douyin, alongside its website and app, its primary digital gateways starting January 2027, while building product development capabilities led by local teams. The direction has changed, but organizational adjustments alone cannot prove that consumers will return.
Why the old model failed is now relatively clear. The next question is: when Nike proactively sells less inventory, does the revenue drop indicate that recovery is underway, or that consumer demand is still deteriorating?
The core of FY2027 is ending the 'over-ship, then discount' cycle first
A temporary drop in revenue does not necessarily mean the adjustment has failed. Nike shipping goods to retailers and recognizing revenue is known in the industry as sell-in; retailers ultimately selling products to consumers is sell-through, representing end-user demand. The past issue was that sell-in outpaced sell-through: revenue was recognized by Nike, but merchandise sat in retailer warehouses and stores waiting to be discounted, naturally depressing orders for subsequent seasons.
Consequently, as Nike now proactively tightens procurement and future orders, short-term revenue will look worse. Judging whether this decline is healthy requires looking beyond shipment volumes to simultaneously monitor sell-through, inventory turnover, and discounts. Whether lower shipments signal recovery depends on whether merchandise is ultimately purchased by consumers.
Retailer Shipments (Sell-in) | Consumer Purchases (Sell-through) | Inventory Turnover & Discounts | What It Represents |
Decline | Stable or improving | Turnover stable or accelerating, discounts decreasing | Proactive inventory adjustment, supporting a turnaround |
Decline | Slight decline | Turnover basically stable, discounts decreasing | Demand remains weak, but channels are beginning to recover |
Decline | Deteriorating significantly | Turnover slowing, discounts increasing | Demand further damaged, inventory clearance not yet successful |
Increase | No improvement | Inventory growth continuously exceeds sales, discounts increasing | Stuffing channels with inventory again |
Nike is attempting to take the first path, but the results have not yet been confirmed. Management expects Q1 FY2027 revenue to decline in the low-to-mid single digits, with the decline in Q2 slowing further compared to Q1; at the same time, year-over-year gross margin expansion will pull forward to Q1 from the originally expected Q2. The company maintains its guidance that cumulative profits across the three quarters from Q4 FY2026 through Q2 FY2027 will remain roughly flat, though this is not full-year profit guidance for FY2027.
More importantly, after revenue expectations worsened, profit expectations were not downgraded proportionally. Tightening procurement and orders is expected to reduce deep discounting, returns, order cancellations, and sales allowances; even without revenue growth, each dollar of revenue could yield higher gross profit.
Localized data has begun to support this transmission chain. In European digital channels, off-price sales fell over 50% year-over-year, and the proportion of full-price sales improved by about 15 percentage points; in Greater China, inventory value and units both saw double-digit declines, while average discounts shrank. A significant portion of North American wholesale revenue growth also stemmed from lower returns, fewer order cancellations, and reduced discounts, rather than simply shipping more goods to retailers.
Reducing discounts is only the first step; supply chain and back-office costs must decrease alongside. Nike is downsizing certain warehousing and distribution facilities, adjusting headcount, and altering product flows from factories to retail outlets. In FY2026, the company recognized $385 million in employee severance costs, of which $154 million was recorded in product costs and $231 million in overhead expenses such as personnel, technology, and administration; related savings are expected to materialize starting in FY2027.
Whether this cost restructuring is healthy depends critically on what Nike is cutting. Management expects Q1 FY2027 back-office expenses to drop, but spending on brand marketing, athlete partnerships, and event promotions to grow in the high single digits. The company aims to trim inefficiencies in organization and logistics while continuing to invest in the World Cup, new products, and brand rebuilding, rather than sacrificing marketing to trade for a single quarter's profit.
After excluding clearly disclosed restructuring costs, profitability in FY2026 improved compared to FY2025, but remains well below historical levels. FY2025 marked the lowest margin year among disclosed periods, and FY2026 showed initial improvement, but this does not mean margins won't face pressure again in coming quarters. If so-called 'one-time restructurings' occur repeatedly, they cannot be treated every year as expenses unrelated to shareholders.
Fiscal Year | Revenue | Operating Margin | Disclosed Restructuring Costs | Reference Margin Excl. Restructuring Costs |
FY2024 | $51.36 billion | 12.30% | $443 million | 13.20% |
FY2025 | $46.31 billion | 8.00% | No major operational adjustments | 8.00% |
FY2026 | $46.40 billion | 8.20% | $385 million | 9.00% |
Operating margin is calculated as gross profit minus brand and sports marketing investments, and minus overhead expenses such as personnel, technology, warehousing, and administration. The figures excluding restructuring costs represent an analytical perspective and are not official non-GAAP metrics disclosed by Nike.
Inventory data aligns more closely with 'no longer deteriorating' rather than 'returned to health.' At the end of FY2026, Nike's inventory stood at approximately $7.5 billion, essentially flat year-over-year; based on cost of goods sold divided by average inventory, inventory turnover was approximately 3.53 times, with inventory turnover days at around 103 days, also close to FY2025 levels. Inventory pressure relative to revenue emerged primarily in FY2025, when revenue dropped about 9.8% while year-end inventory declined only about 0.4%; in FY2026, both revenue and inventory were roughly flat. Inventory efficiency stopped worsening, but did not significantly improve.
Fiscal Year | Year-End Inventory | Revenue YoY | Days Sales of Inventory (DSI) | Core Takeaway |
FY2024 | $7.519 billion | 0.30% | Approx. 102 days | Inventory-to-revenue relationship relatively healthy |
FY2025 | $7.489 billion | -9.80% | Approx. 103 days | Revenue declined significantly, with almost no proportional inventory reduction |
FY2026 | $7.501 billion | 0.20% | Approx. 103 days | Stopped deteriorating, but no obvious improvement yet |
Inventory turnover days are estimated based on cost of goods sold and average inventory at the beginning and end of the year. This metric measures only the overall efficiency of Nike's own inventory holdings and does not reflect channel inventory held by retailers.
Therefore, an increase in year-end inventory unit count alone does not prove that channel pressure is worsening. The company did not disclose the specific product composition of the inventory increase, which could include legacy overstock as well as stock building for new products. Only when new footwear maintains low discounts after launch, overall turnover does not slow down, and second or third reorders materialize can it retroactively prove that previous inventory expansion was reasonable stocking. Nike officially disclosed only that inventory dollar value remained flat, with unit count growth offset by changes in product mix.
Furthermore, merchandise already sold to retailers like Foot Locker and Dick's is no longer recorded in Nike's balance sheet inventory, even if the goods remain piled up in retailer warehouses or stores. Assessing channel health therefore requires combining sell-through, retailer inventory, returns, cancellations, average discounts, and reorders, rather than looking solely at Nike's own inventory value or unit volume.
Consequently, FY2027 does not need to prove that revenue has recovered; it needs to prove that legacy styles continue clearing out, inventory turnover and discounts improve, gross margins expand, and repeat reorders begin to appear. If these conditions hold, profit recovery will have a foundation; as for whether growth can return, that can only be answered by the next slate of products.
Saved costs can only repair margins; new products and the China market are required to restart growth
Cost restructuring and promotional pullbacks can lift margins once, but sustained growth must stem from consumers willing to buy new products at full price again. Nike has now demonstrated management's willingness to absorb short-term sales pressure and proven that certain performance products can grow; what remains unproven is whether this formula can be scaled to product categories accounting for a larger share of revenue.
Running has provided the first positive case study. According to management, Nike Running has achieved double-digit growth for five consecutive quarters, generating about $1 billion in incremental revenue during this period; the overall performance sports category grew in the mid-single digits in FY2026. This shows Nike has not completely lost its innovation capability and suggests that reorganizing products, marketing, and channels around specific sports can be effective.
However, Running's success alone is insufficient to turn around the entire group. What Nike terms Sportswear refers to footwear and apparel geared toward everyday lifestyle wear rather than professional training or competition; Jordan Streetwear refers to trend-focused and casual items within Jordan. Combined, these account for roughly half of company revenue, and management expects them to remain in negative growth in FY2027, with gradual improvement occurring only in the second half.
Thus, the dozen-plus new Sportswear shoes launching in H2 FY2027 represent actions, not results. Nike stated these products will feature new silhouettes, new technology, local creators, and community-driven promotion, rather than repeatedly retroing archived sneakers. However, sell-outs at initial launch are not enough; what matters more is whether retailers are willing to place second and third reorders after selling through the initial batch while maintaining full price.
When assessing a turnaround, the weight of evidence must increase step by step. Management acknowledging issues in the old strategy merely proves that the diagnosis has become clear; cutting classic models, orders, and promotions shows the company is willing to bear short-term costs; improvements in inventory turnover, discounts, and sell-through indicate channels are beginning to recover; new products maintaining full price and driving repeat reorders show genuine consumer acceptance; and ultimately, revenue, profit, and cash flow must grow in tandem.
Stage of Evidence | What It Proves | What It Still Cannot Prove |
Management acknowledges flaws in old strategy | Clearer diagnosis of problems | Execution will definitely be effective |
Cutting classic models, orders, and promotions | Company willing to bear short-term costs | Consumer demand has recovered |
Improvements in inventory turnover, discounts, and sell-through | Channels returning to health | New products can fill the revenue gap |
New products maintain full price and yield repeat reorders | Consumers willing to make sustained purchases | Ability to achieve global scale |
Simultaneous growth in revenue, profits, and cash flow | Turnaround financially confirmed | — |
Nike is currently positioned roughly between Stage 2 and Stage 3. Management has adjusted organization and orders, and certain channel metrics in Europe, China, and North America have begun to improve; however, new products in Sportswear and Jordan have yet to achieve scaled repeat reorders. Equating 'the company knowing where it went wrong' directly to 'a successful turnaround' remains premature.
Whether product momentum can scale also depends on channel placement. Specialty running stores establish performance credibility; major retailers like Dick's and Foot Locker provide try-ons, shelf space, and volume; while official websites, apps, and owned stores excel at member engagement, exclusive products, and brand experiences. The new channel model is not a retreat from DTC back to wholesale, but rather re-assigning distinct channels to what they do best. Wholesale revenue represents real demand only when it improves alongside sell-through and reorders.
China represents the ultimate proving ground for whether products and channels can be repaired simultaneously. Phase one takes place in FY2027: reducing promotions, liquidating older inventory, upgrading key stores, and restructuring an overly fragmented digital distribution network. While this helps standardize pricing and product presentation, it will reduce sales access points in the short term, making local profit stabilization ahead of revenue recovery more worthy of attention than short-term top-line figures.
Phase two will not emerge until FY2028. Nike has appointed its first local product creation head for Greater China to oversee products designed, developed, and manufactured locally. Because Nike's fiscal year ends in late May, the initial product batch scheduled for launch in late 2027 belongs to FY2028 and cannot support FY2027 profit forecasts.
Whether local products succeed cannot be judged merely by the inclusion of Chinese cultural elements. The true benchmarks are whether development cycles shorten, whether consumers buy at full price, whether retailers place repeat reorders, and whether Greater China revenue and profit resume growth in the same direction. Until then, China channel adjustments could either rebuild the brand or result in further market share loss due to fewer sales access points; both outcomes remain possible.
At this point, the operational logic splits into two steps: FY2027 validates margins, while FY2028 validates growth. Whether the stock price reflects these steps in advance depends on how much recovery is already priced in.
The market will not wait until FY2028 to pay, but a 12-year low offers no safety net for investors
Stock prices can rebound ahead of earnings, but genuine re-rating must be accompanied by an end to downward revisions in future earnings forecasts. If inventory turnover, discounts, and gross margins show continuous improvement, the market may revise FY2028 and FY2029 profit expectations upward in advance; if P/E expansion is driven solely by falling earnings estimates, it holds no positive significance.
Currently, the market is not pricing Nike strictly for failure. Based on the August 28, 2026 closing price of $39.60, FactSet consensus analyst EPS estimates for FY2027, FY2028, and FY2029 stand at approximately $1.73, $2.18, and $2.38, corresponding to P/E ratios of roughly 22.9x, 18.2x, and 16.6x. FY2027 and FY2028 estimates are down from $1.82 and $2.34 three months ago, indicating that while the market expects some degree of recovery, it is increasingly cautious about the pace.
Putting revenue, margins, and reasonable valuation multiples together clarifies the risk-reward distribution at current price levels.
Scenario | Medium-Term Operating Assumptions | Implied EPS | Valuation Multiple Assumptions | Implied Stock Price | Relative to $39.60 |
Bear | Revenue $44.5B; operating margin 6.5%; new Sportswear products fail, China promotions increase again | Approx. $1.56 | 16–18x | Approx. $25–$28 | -37% to -29% |
Base | Revenue $47.5B; operating margin 8.5%; legacy clearing continues, new products partially succeed | Approx. $2.17 | 20–22x | Approx. $43–$48 | +10% to +21% |
Bull | Revenue $50.0B; operating margin 10.5%; new products scale reorders, China recovers | Approx. $2.83 | 23–25x | Approx. $65–$71 | +64% to +79% |
Scenario calculations assume a 20.3% tax rate and approximately 1.481 billion diluted shares, simplifying by excluding smaller net interest and other income; they do not represent company guidance or price targets. Data source: Nike FY2026 10-K.
The base case EPS of $2.17 is almost identical to current market consensus for FY2028 ($2.18), indicating that the present stock price already incorporates a limited recovery over the next two years. The true expectation gap lies in whether the recovery arrives earlier, higher, or lasts longer.
This table also makes the 'asymmetry' testable: the bear case still carries downside risk of roughly 29% to 37%, showing no risk-free bottom; however, upside in the bull case reaches approximately 64% to 79%, roughly twice the midpoint decline of the bear case. While not a target price, this outcome demonstrates that under a non-aggressive probability distribution, return profiles are starting to skew upward.
Profit margin is critical because its impact on EPS far exceeds a 1–2 percentage point variation in top-line revenue. Based on FY2026 revenue of approximately $46.4 billion, every 1 percentage point increase in operating margin adds roughly $464 million in pre-tax profit; assuming a 20.3% tax rate and current share count, this translates to an EPS gain of about $0.25. If discounts, product mix, and supply chain costs jointly improve by a few percentage points, profit growth could significantly outpace revenue.
The balance sheet buys time for Nike, but does not establish a hard floor for the stock price. At the end of FY2026, the company held about $9 billion in cash and short-term investments against total debt of roughly $7.9 billion, leaving it in a slight net cash position. Operating cash flow stood at $2.868 billion, and subtracting $684 million in capital expenditures yielded free cash flow of about $2.184 billion, below the roughly $2.4 billion paid in cash dividends that year. At current market cap, the free cash flow yield sits around 3.7%, which hardly qualifies as deeply undervalued.
FY2026 cash flow was impacted by uncollected tariff refunds, which the company largely recovered after the fiscal year ended; thus, $2.184 billion slightly understates underlying cash conversion. However, tariff refunds are non-recurring and cannot substitute for operational recovery in products and margins.
The next direct test comes on October 1, 2026, when Nike reports Q1 FY2027 results. What the market needs to see is not a single figure beating expectations, but a set of mutually reinforcing indicators: whether gross margin can expand while revenue remains weak, whether turnover stays stable, whether discounts continue falling, and whether management maintains its profit outlook for upcoming quarters. There are relatively few key metrics that truly need tracking over the coming quarters:
Tracking Item | Supports Turnaround | Delays or Refutes Turnaround |
Revenue | Fewer shipments to retailers, but consumer sell-through stabilizes | Shipments and sell-through deteriorate significantly together |
Inventory | Turnover rate stable/improving, DSI stable/falling, new inventory aligns with new launches and future demand, discounts stable/falling | Inventory growth continuously exceeds sales, turnover slows, legacy inventory age and discounts rise simultaneously |
Gross Margin | Expands YoY excluding clear one-off items | Improvement delayed, or relies primarily on cuts to brand spending |
Wholesale Channel | Sell-through and repeat reorders improve in tandem | Increase driven solely by shipments to retailers |
Sportswear & Jordan | New products maintain full price and generate 2nd and 3rd reorders | Rapidly enter promotion after initial launch |
China | Regional profits stabilize first, inventory and discounts continue falling | Revenue and market share continue steep drops after sales access points shrink |
Cash Flow | Profit improvements convert into free cash flow | New restructuring cash outflows continuously recur |
Market Expectations | FY2028/2029 earnings revisions stop falling and turn upward | Earnings estimates for the next two years continue falling |
Nike's turnaround remains unproven, and a nearly 80% stock decline alone does not constitute a buy thesis. The company has completed the relatively easy steps of acknowledging mistakes, cutting classic models, and restructuring organizationally; the truly difficult work lies in clearing legacy stock smoothly, establishing repeat reorders for new products, restoring brand relevance in China, and converting margin gains into cash flow.
Around $39.60, however, the risk-reward profile has begun tilting upward. The bear case still carries downside of roughly 30%, offering a thin margin of safety; in contrast, the base case offers 10% to 20% upside, while the bull case presents over 60% upside, giving upward tail elasticity significantly greater than downward tail risk.
Focus on margins in FY2027, then growth in FY2028. Only when inventory turnover, discounts, sell-through, and new product reorders validate one another will an early stock rebound reflect a genuine re-rating of future earnings, rather than another rally built on brand faith.
This article is provided for research and informational purposes only and does not constitute investment advice.
This content was translated using AI and reviewed for clarity. It is for informational purposes only.
Recommended Articles










Comments (0)
Click the $ button, enter the symbol, and select to link a stock, ETF, or other ticker.