


Oil Price Forecast: Will Brent Continue to Rise After Topping $90 as US-Iran Conflict Escalates Again?



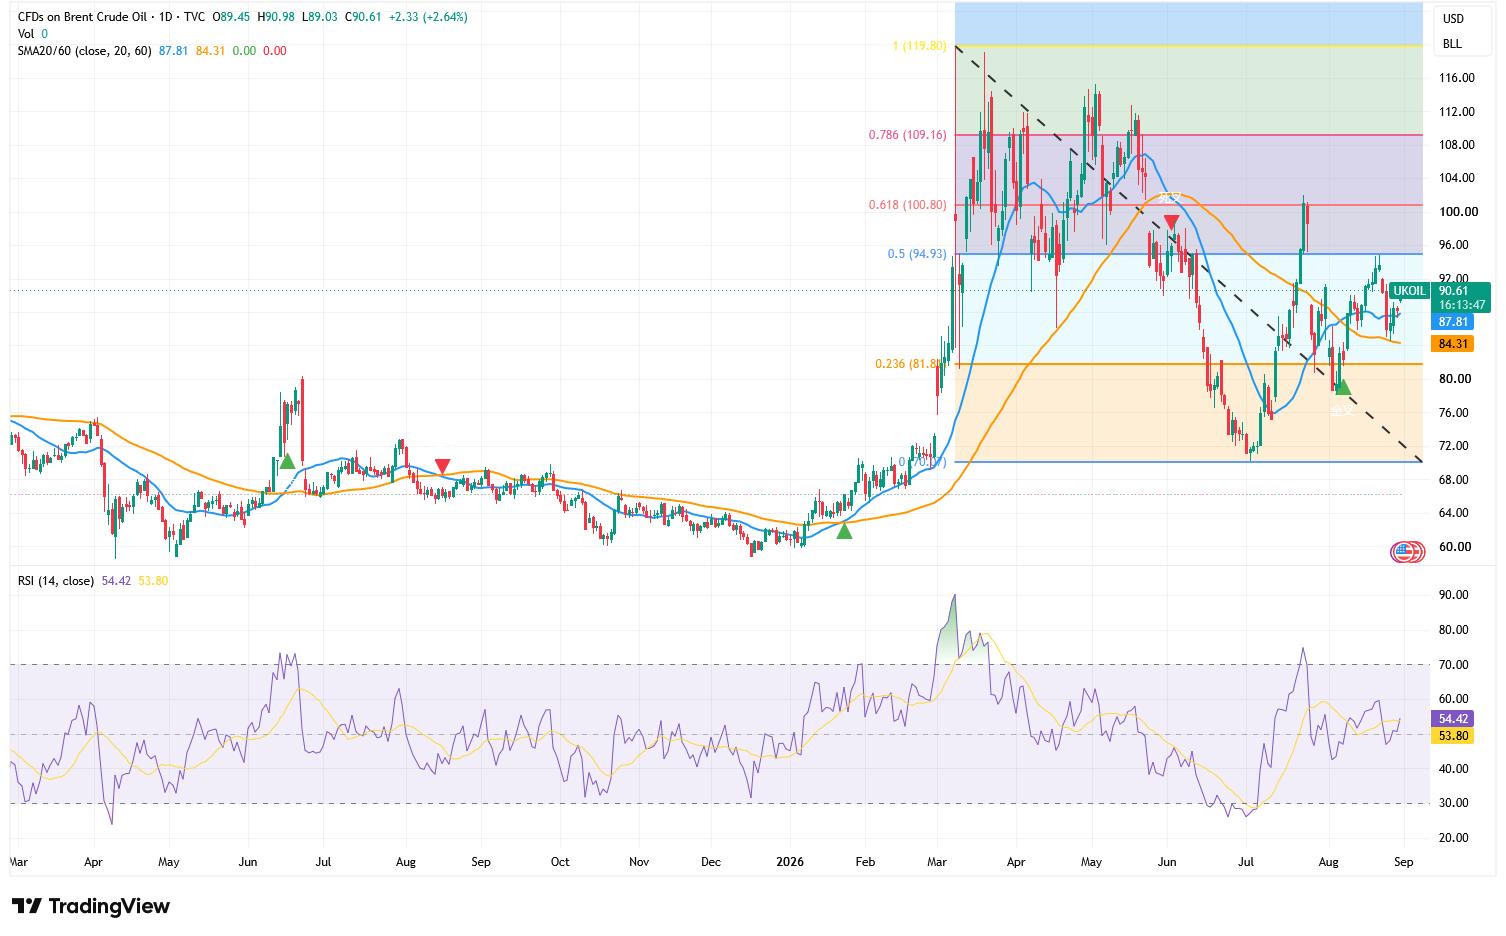
Renewed U.S.-Iran military clashes in the Strait of Hormuz have escalated shipping risks, pushing Brent crude back above $90 a barrel. Stalled negotiations and persistent geopolitical tensions suggest oil prices will remain volatile. Technically, Brent has broken above its 20-day and 60-day moving averages and the 38.2% retracement level near $89.45, turning the short-term trend bullish. With the RSI at 54.42 showing recovering upward momentum without overheating, sustained consolidation above $90 could target resistance at $94.93 and potentially $100.80, while a breakdown below $90 risks retesting the 20-day moving average at $87.81.

TradingKey - The U.S. and Iran exchanged direct fire again after more than a month, rapidly escalating shipping risks in the Strait of Hormuz and pushing international oil prices back above $90 per barrel.
During the Asian trading session on August 31, Brent crude (UKOIL) prices rebounded to above $90, while WTI crude (USOIL) rose to $86/barrel.
Why Are Crude Oil Prices Rising?
On August 30 local time, the U.S. military launched airstrikes against two rocket launchers on Iran's Larak Island, marking the first U.S. strike on targets inside Iran since late July.
U.S. Central Command spokesman Tim Hawkins stated that U.S. forces detected Islamic Revolutionary Guard Corps (IRGC) personnel preparing to launch mine-bearing rockets into the Strait of Hormuz. With the U.S. military having only recently completed mine-clearing operations in the international shipping lanes, Washington described the action as a preemptive strike to protect commercial shipping.
Iran rejected the U.S. account, stating that the strikes caused military and civilian casualties. The IRGC subsequently announced a missile attack on U.S. military targets in Jordan, though the missiles were reportedly intercepted by U.S. and Jordanian defense systems.
Although the U.S. operation targeted only two launchers and was significantly smaller in scale than the hours-long bombardment in late July, Iran's swift retaliation underscores that the situation could escalate further.
Connecting the Persian Gulf and the Gulf of Oman, the Strait of Hormuz is a vital conduit for crude oil exports from Saudi Arabia, Iraq, Kuwait, the UAE, and Iran. Prior to the conflict, roughly one-fifth of global oil supply passed through the waterway; thus, even a partial disruption to transit could significantly impact international energy markets.
Michael Alfaro, chief investment officer at energy hedge fund Gallo Partners, noted that the fresh exchange of fire once again highlights the fragility of the ceasefire and demonstrates Iran's ongoing capability to disrupt free navigation through the Strait of Hormuz. As long as this threat persists, the geopolitical risk premium is unlikely to fully recede from oil prices.
Meanwhile, U.S.-Iran negotiations remain stalled. The deal originally intended to halt hostilities and reopen the strait has collapsed, with the U.S. maintaining pressure through military actions and sanctions, while Iran leverages its influence over the waterway as a bargaining chip. This stalemate suggests that even if both sides temporarily avoid a full-scale war, oil prices are likely to remain highly volatile for an extended period.
Crude Oil Price Technical Analysis: Will Brent Crude Continue to Rise?
Source: TradingView
On the daily chart, Brent crude recently rose to $90.61, breaking back above the $90 psychological mark, and has cleared its 20-day moving average of $87.81 and 60-day moving average of $84.31. The 20-day moving average remains above the 60-day moving average, and combined with oil prices breaking above the downtrend line extending from the March high, this indicates that the previous downward structure has improved, with the short-term trend shifting toward a bullish bias.
At the same time, oil prices have broken above the 38.2% retracement level at approximately $89.45, with the next key resistance located at $94.93. If the daily chart can close firmly above $90 and further break through $94.93, upside space could open toward $100.80; if the US-Iran conflict continues to push up the supply risk premium, oil prices could challenge $109.16 under a strong market scenario.
The RSI currently stands at 54.42, above the 50 threshold dividing strength and weakness and the 53.80 signal line, indicating that upward momentum is recovering. Meanwhile, there is still room before reaching the overbought territory above 70, so technicals have not yet shown clear signs of overheating.
To the downside, initial focus should be on the $89–$90 range. If oil prices hold this area after a pullback, it indicates that $90 could turn from resistance into support, leaving the upward structure intact; if prices drop back below $90, they may retest the 20-day moving average of $87.81. A further break below the 60-day moving average of $84.31 would weaken the current rebound structure, shifting downside support to $81.89.
This content was translated using AI and reviewed for clarity. It is for informational purposes only.
Recommended Articles











Comments (0)
Click the $ button, enter the symbol, and select to link a stock, ETF, or other ticker.