


TSMC Stock Price Prediction: As AI Chip Demand Heats Up, Can TSM Hit New Highs in 2026?



AI Podcast


TSMC benefits significantly from expanding global AI infrastructure and a shifting market mix of GPUs and custom chips. As a neutral foundry capturing roughly 72% of global market share, TSMC reported robust second-quarter 2026 financial results, driven by high-performance computing and advanced nodes, with full-year revenue growth projected to exceed 40%. The company’s deep technological moats, extensive multi-year customer collaborations, and advancing 2nm and A14 roadmaps reinforce its competitive advantage. Technically, the stock remains in a medium-term bullish consolidation above key support at $411–$415, with a breakout above $435 and $474 required to challenge new highs.
TradingKey - As artificial intelligence infrastructure enters a phase of continuous expansion, chip design companies such as Nvidia (NVDA), AMD (AMD), and Broadcom (AVGO) continue to benefit, but what truly determines whether these AI chips can be deployed at scale is the underlying wafer fabrication and advanced packaging capabilities.
Among them, TSMC (TSM) remains at the core of this industry chain. Unlike fabless chip design companies such as Nvidia and AMD, TSMC does not rely on the outcome of any single GPU or AI accelerator, but instead manufactures advanced-node chips for diverse customers. Therefore, as long as global investment in AI computing power continues to grow, TSMC is expected to secure sustained orders from the expansion of chip demand.
TSMC pioneered the dedicated wafer foundry model in 1987, choosing not to compete with customers in chip design, but focusing instead on manufacturing. In 2024, using 288 process technologies, the company produced 11,878 products for 522 customers, covering markets such as high-performance computing, smartphones, automotive, IoT, and consumer electronics.
TSMC May Benefit Whether From GPUs or Custom Chips
The AI chip market is gradually shifting from an Nvidia GPU-dominated landscape to a pattern where GPUs and custom chips coexist. Amazon continues to expand its deployment of Trainium chips, Alphabet is also increasing its scale of TPU usage, and other large cloud computing enterprises are developing their own AI accelerators through partners such as Broadcom and Marvell.
While this shift may affect the market shares of Nvidia, AMD, and custom chip design companies, it will not necessarily weaken TSMC's orders. Regardless of which company designs the chip, as long as the product requires advanced nodes, advanced packaging, and large-scale volume production, TSMC generally remains one of the most vital manufacturing options.
This "neutral supplier" status is already reflected in the company's financial results. In the second quarter of 2026, TSMC's revenue reached $40.2 billion, up 33.7% year-over-year; in New Taiwan dollar terms, revenue grew 36%. Net profit increased 77.4% year-over-year to NT$706.56 billion, with gross margin reaching 67.7% and operating margin rising to 60.3%.
Among this, the high-performance computing business accounted for 66% of total revenue, up from 61% in the previous quarter, while advanced nodes at 7nm and below accounted for 77% of wafer revenue. The 2nm process node, which has just begun ramping up, already contributed 3% of wafer revenue, indicating that the new generation of products is rapidly entering the volume production phase.
TSMC expects third-quarter revenue to be between $44.6 billion and $45.8 billion, with the midpoint of the range up approximately 37% year-over-year. The company also raised its full-year 2026 U.S. dollar revenue growth forecast to slightly above 40%, reflecting that demand for AI and advanced nodes remains strong.
Where Does TSMC’s Advantage Lie?
TSMC captured approximately 72% of global foundry market revenue in the first quarter of 2026, far outpacing its competitors. Its competitive edge stems not only from process technology, but also from manufacturing scale, yield rates, advanced packaging capabilities, and long-standing customer trust.
Mass production of advanced chips is not simply a matter of choosing a factory after finalizing a design; customers typically need to collaborate with foundries years in advance to co-develop process technology, verify designs, adjust packaging solutions, and reserve capacity. TSMC management noted that the entire process—from technology development and product design to building capacity and achieving volume production—can take over five years. This makes it difficult for major customers to quickly switch suppliers based merely on short-term price changes.
TSMC's massive customer base and order volume in turn allow it to invest heavily in next-generation R&D. The company can leverage existing orders to expand capacity and improve yields, and then attract new customers with even more advanced process nodes, creating a virtuous cycle where technology, scale, and cash flow mutually reinforce one another.
Furthermore, this competitive advantage continues to widen.
TSMC is already advancing its 2nm capacity ramp and plans to achieve mass production of its A14 process node in 2028. Compared to 2nm, A14 is projected to offer a 10% to 15% performance gain at the same power consumption, or a 25% to 30% power reduction at the same performance, along with a nearly 20% increase in chip density.
TSMC Stock Price Forecast: Can TSM Hit a New High in 2026?
Source: TradingView
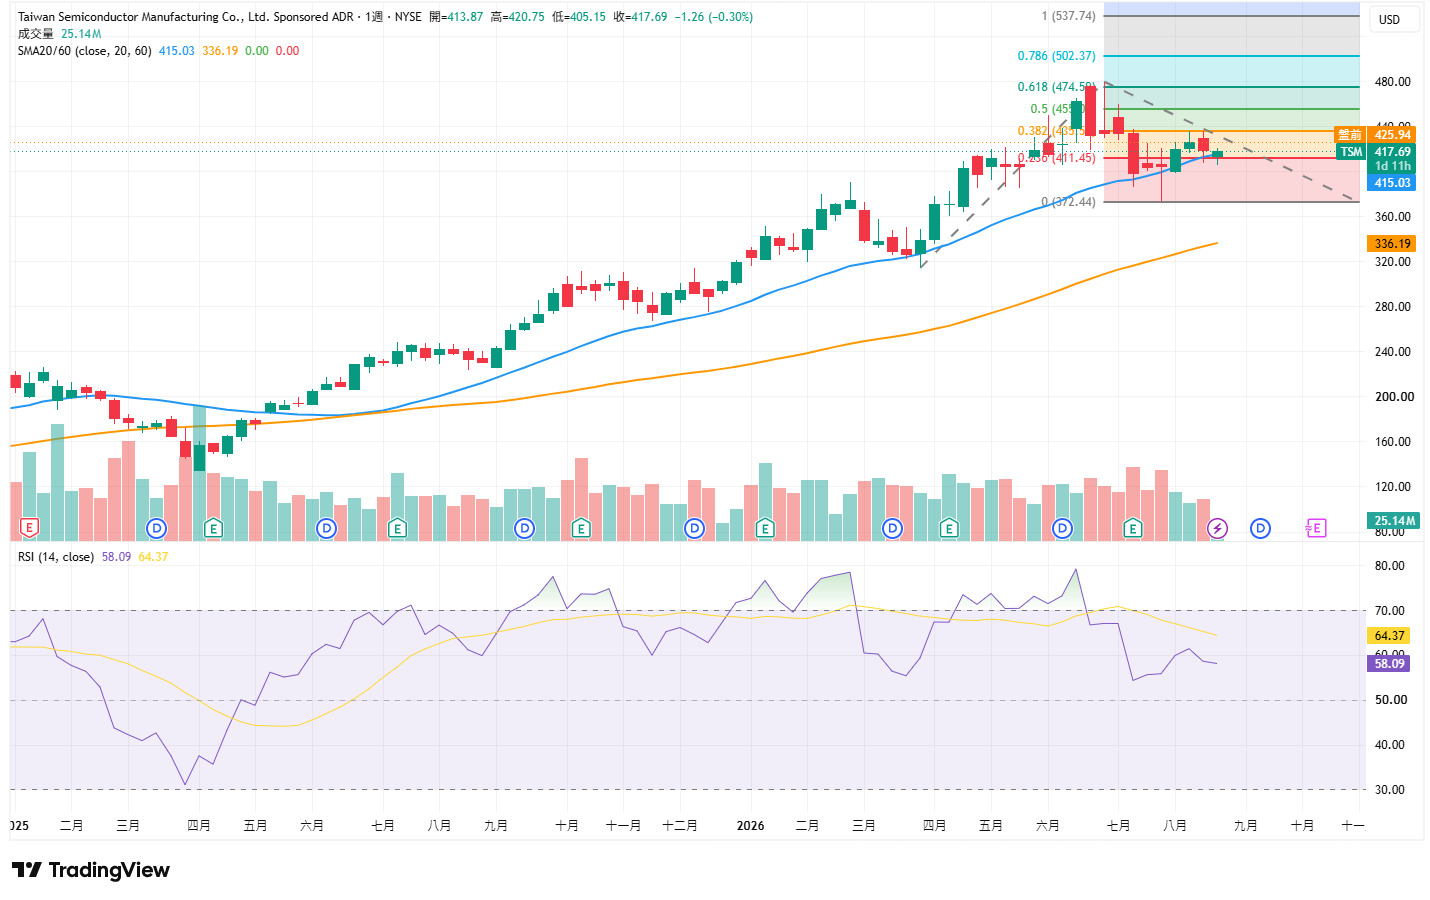
From a weekly chart perspective, TSMC ADR closed at $417.69 on the 26th, remaining slightly above its 20-week moving average of $415.03 and well above its 60-week moving average of $336.19. The 20-week moving average remains above the 60-week moving average, with both moving averages generally trending upward, indicating that the medium- to long-term bullish structure remains intact. However, after pulling back from its peak of $474.59, the stock price remains capped by a descending trendline, and a new round of upside momentum has yet to be confirmed.
The 0.236 level at $411.45, together with the 20-week moving average, forms the current key support zone. As long as TSM remains above $411–$415, the recent price action can still be viewed as high-level consolidation, with potential for another upside breakout.
To the upside, primary focus is on the $425–$435 range, where around $435 coincides with both the descending trendline and the 0.382 extension level. If TSM can close above $435 on strong volume, it would signal a break from the corrective pattern of lower highs, with the next target at the 0.5 level of $455. A further breakout above $455 could see the stock retest its previous high of $474.59.
The $474–$475 range serves as a critical threshold to determine whether TSM can reach new highs in 2026. A weekly close above $475 on heavy volume would confirm the resumption of the medium-term uptrend and open up upside space toward $502.37 and $537.74.
In terms of momentum, the 14-week RSI stands at 58.09, remaining above 50, which indicates that overall momentum is bullish; however, it is below its smoothed signal line of 64.37, showing a weakening in recent upward strength. If the RSI crosses back above the signal line and holds above 60–65 alongside a gradual expansion in trading volume, it will enhance the credibility of a price breakout above $435 and $475. Conversely, if the stock price rises while the RSI continues to trend lower, caution is warranted regarding a potential bearish divergence at the top.
This content was translated using AI and reviewed for clarity. It is for informational purposes only.
Recommended Articles











Comments (0)
Click the $ button, enter the symbol, and select to link a stock, ETF, or other ticker.