


Dell Stock Price Forecast: Barclays Downgrades Rating as Earnings Beat Margin May Narrow Sharply; Will the Long-Term Rally End Here?



AI Podcast


Dell shares fell over 12% on October 14, hitting a near one-month low after Barclays downgraded the stock to "Hold" due to excessive valuation and delayed enterprise AI inflection points. Although AI server revenue is projected to triple to $75 billion, diminishing upside surprises may cap stock gains. Technically, the sell-off broke below key moving averages and the recent consolidation range, testing primary support near $502. While long-term trend support remains intact, failure to hold current levels risks deepening the retracement toward the 160-day moving average, whereas stabilization could prompt a recovery.

TradingKey - Dell (DELL) fell more than 12% in intraday trading on October 14, touching a low of $502.3 to hit a near one-month low after Barclays downgraded the stock to "Hold."
Barclays stated that Dell Technologies' valuation has run up excessively, and a material inflection point in enterprise AI has yet to be seen.
Analyst Tim Long noted that the seven enterprise-related stocks in his coverage universe have gained an average of about 140% this year, compared with a 14% rise in the S&P 500 index over the same period. Currently, this basket of stocks trades at a P/E ratio of about 21 times expected 2027 earnings, well above its five-year average of about 15 times.
Long believes the AI server business is already a successful venture for Dell Technologies, with operating margins holding steady at around 5%. His model projects that AI server revenue will grow to $75 billion this fiscal year (roughly triple the previous level), and he would not be surprised by potential upside to the $10 billion estimate for fiscal 2028, though growth is expected to slow.
Long still sees potential upside to earnings estimates, but noted that "the degree of upside surprises will narrow significantly," which may limit further upside for the stock.
From a technical perspective, Dell's stock price has fallen out of its recent high-level consolidation range. Currently, following a sharp gap down, it is testing key retracement support, with no clear signal of stabilizing yet, though a reversal of the long-term uptrend has not been confirmed.
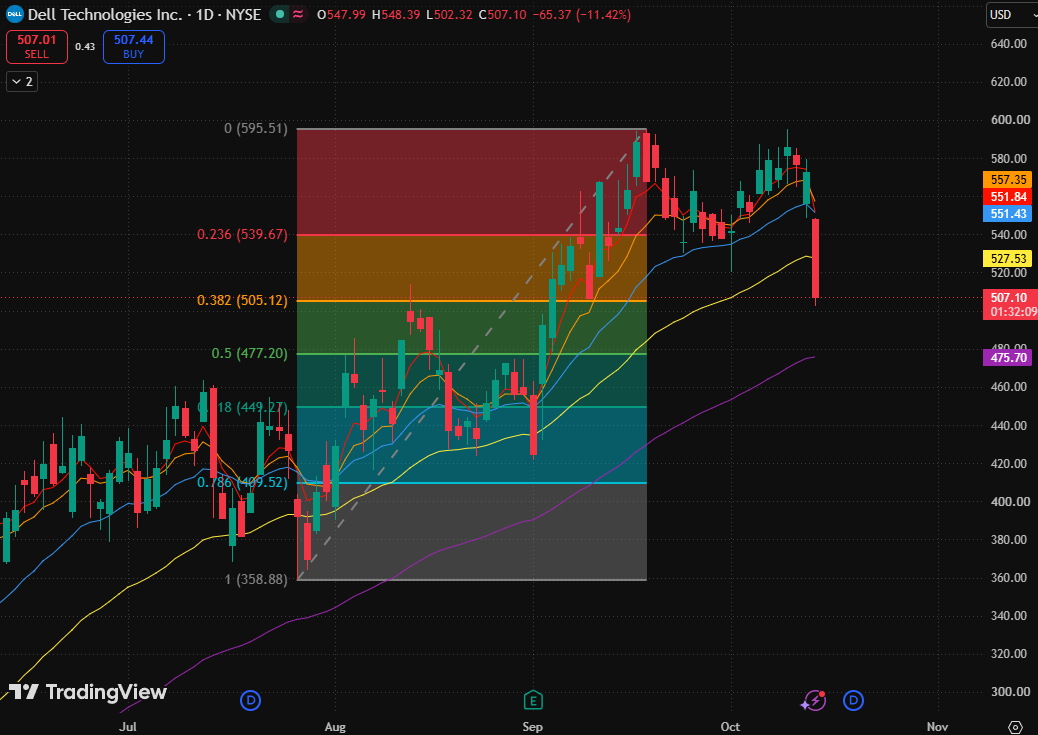
<a i=0>Dell daily chart, Source: TradingView</a>
Previously, the stock rose from a low of $358.88 to $595.51 before pulling back, and subsequent rallies failed to decisively break above the previous high. This sell-off directly broke below the lower boundary of the recent consolidation, turning the previous high-level oscillation into a deeper retracement.
In terms of Fibonacci structure, after losing the 0.236 Fibonacci retracement level ($539.67), the price quickly dipped toward the current pivot. It breached this level during intraday trading before recovering slightly, indicating that support is being tested.
The 5-day, 10-day, and 20-day moving averages stand at $551.84, $557.35, and $551.43, respectively. Short-term moving averages are beginning to weaken, though they have not formed a complete bearish alignment. The price has also broken below the 80-day moving average, while the 160-day moving average is still sloping upward, implying that the short-to-medium-term structure has been damaged, but the long-term trend support remains intact.
The intraday low ($502.32) and the 0.382 Fibonacci retracement level ($505.12) serve as primary support levels, which also correspond to the pullback zone from early September. This is the main observation zone for determining whether the decline can temporarily halt, as well as an important line in the sand for bulls and bears. If the stock stabilizes around the current pivot, it could still recover toward the vicinity of the 80-day moving average ($527).
If the stock fails to hold this level, the retracement is likely to deepen further, potentially invalidating the long-term uptrend and testing the range between the 160-day moving average ($475.70) and the 0.5 Fibonacci retracement level ($477.20).
This content was translated using AI and reviewed for clarity. It is for informational purposes only.
Recommended Articles










Comments (0)
Click the $ button, enter the symbol, and select to link a stock, ETF, or other ticker.