


S&P 500 Index Forecast: JPMorgan Raises Target to 8,000; Can AI Earnings Push US Stocks to New Highs?



AI Podcast


The S&P 500 fluctuates near record highs as robust corporate earnings and AI monetization outweigh valuation and macroeconomic risks. Major financial institutions have raised their long-term index and EPS forecasts, driven by strong earnings surprises and surging tech sector demand. Technically, the index maintains a medium-to-long-term bullish trend. The primary resistance stands at 7,800, with a breakout paving the way toward the 8,000 target. Key downside support is located at 7,600; a breach below this level could trigger a deeper correction toward the 7,000 threshold, threatening the short-term bullish market structure.

TradingKey - The S&P 500 Index has recently continued to fluctuate near record highs. After a rapid rally in the first half of the year, U.S. equities have entered a repricing phase between high valuations and strong earnings. On the one hand, AI capital expenditure, earnings growth among tech giants, and corporate earnings consistently beating expectations provide support for the index; on the other hand, Federal Reserve interest rates, market valuations, and geopolitical risks are also limiting further upside potential.
Corporate Earnings Become Core Support for S&P 500 8,000 Target
JPMorgan's core rationale for raising its S&P 500 target is built on a significant improvement in corporate earnings expectations.
According to JPMorgan data, among the 87% of S&P 500 constituents that have reported earnings, 78% of companies beat market expectations. More notably, corporate earnings exceeded expectations by an average of about 31%, significantly higher than the average level of around 9% over the past four quarters; even excluding one-off factors, the average earnings surprise still reached approximately 11%.
Driven by strong earnings reports, JPMorgan raised its 2026 S&P 500 EPS forecast to $365, representing a year-over-year increase of about 35%, and further raised its 2027 forecast to $420, with an expected year-over-year growth of 15%. Meanwhile, the bank maintains its forward P/E assumption at around 20x, without supporting its 8,000-point target by further raising valuation multiples.
Goldman Sachs shares a similar assessment. Goldman Sachs previously raised its end-2026 S&P 500 target from 7,600 to 8,000 points and projected S&P 500 EPS to reach $340 in 2026, up 24% year-over-year, and grow further to $385 in 2027. Goldman Sachs noted that corporate earnings performance in the first quarter was significantly stronger than expected, serving as a key reason for raising its index target.
AI Investments Start to Pay Off as Tech Giants Remain Key to S&P 500 Gains
Another key variable determining whether the S&P 500 Index can break through 8,000 points lies in big tech companies' return on AI investments.
In the past, the market's biggest concern lay in tech giants' hyperscale AI capital expenditures. Tech giants such as Microsoft (MSFT), Alphabet (GOOGL), Amazon (AMZN), and Meta (META) invest hundreds of billions of dollars annually to build AI data centers, but when these capital expenditures will truly generate revenue and profit remains uncertain.
A recent report from JPMorgan points out that such concerns are showing signs of easing. Among them, Alphabet, Amazon, and Microsoft have begun to demonstrate clear AI monetization capabilities, mainly reflected in three areas: cloud growth rates, order backlog, and operating cash flow improvements.
More importantly, JPMorgan observed that hyperscale cloud providers' backlog coverage relative to capital expenditures is increasing, and the book-to-bill ratio is also improving. This means the growth rate of AI-related demand and orders is gradually catching up with, or even exceeding, the expansion rate of capital expenditures.
For the S&P 500 Index, if the AI revenues of Microsoft, Alphabet, Amazon, Meta, and Nvidia (NVDA) continue to grow, the earnings growth of big tech companies can still provide strong support for the index's EPS even if other sectors show mediocre performance.
S&P 500 Index Technical Analysis
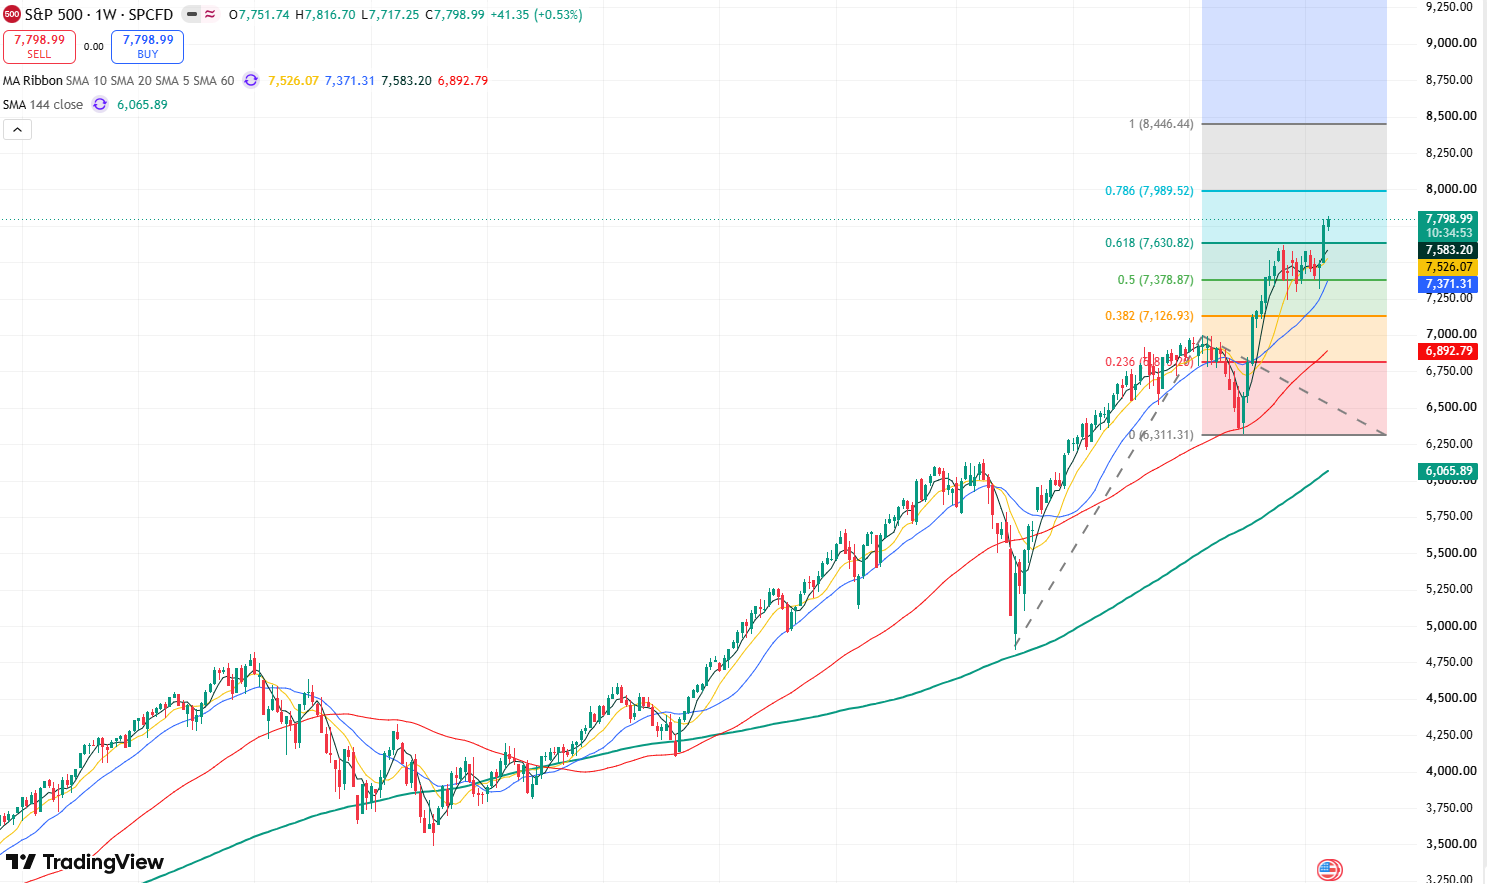
S&P 500 Index weekly chart, Source: TradingView
Looking at the weekly chart of the S&P 500 Index, the overall candlestick movement presents a clear structure of higher highs and higher lows, indicating that the overall candlestick trend remains upward. Meanwhile, the moving average system shows that SMA60 and SMA144 maintain a bullish alignment, further confirming that the medium-to-long-term trend remains bullish.
Currently, the primary resistance level to watch above is 7800. If the index breaks above and holds firmly over this position, upside space toward the 8000 mark will open up. If it further breaks through 8000, the index may open up upside space toward 8500.
To the downside, the key support level to watch is 7600. If this level is lost, the index may pull back toward 7500, and further down to 7300. If the index loses 7300, its short-term bullish structure will be damaged, entering a deeper correction phase that may test the 7000 mark on the downside.
This content was translated using AI and reviewed for clarity. It is for informational purposes only.
Recommended Articles








Comments (1)
Click the $ button, enter the symbol, and select to link a stock, ETF, or other ticker.