


Intel's Data Center Surged 59% — So Why Did the Stock Sink to $95 Support?



AI Podcast


Intel’s Q2 2026 performance featured robust 25% revenue growth and strong Data Center results, yet the stock declined toward the $95.68 support level. Despite solid operational metrics, investor sentiment remains bearish due to surging capital expenditures, negative free cash flow, and staggering $2.1 billion quarterly losses in the foundry segment. Liquidity concerns and mounting capex pressure overshadow core business gains. Technically, the stock exhibits weak momentum with the RSI dropping below 50 and facing resistance at the descending trendline. Until foundry profitability improves or free cash flow stabilizes, near-term capital intensity presents significant downside risks.

TradingKey - Intel (INTC)'s Q2 2026 results show a company willing to take out loans to make its products. Data Center revenue grew by 59% to $6.3 billion, and the company exceeded revenue predictions by $2.68 billion, bringing in $16.1 billion ($15.1 billion predicted) with a non-GAAP gross margin of 41.8%. But the stock dropped from $112.70 after the earnings report to $97.57, and is now a few dollars from their projected dividend payout support level of $95.68. This is also what killed their stock. Capital requirements continue to grow.
The company increased its capital expenditure budget for 2026 by $2 billion to $20 billion from the $18 billion they planned on spending, and will most likely increase it even more for 2027. It also should be noted that their contract chip manufacturing business, their big bet, is losing them $2.1 billion per quarter.
From the perspective of a day trader, the breakdown of the company is evident: INTC made a repeated selling effort by touching a descending trend line, the RSI is moving under 50, and the $95.68 support has now come into play. For the long-term investor, the question is will management be able to achieve a turnaround before cash continues to drain?
The Operational Story Is Actually Strong
Let's discuss what Intel actually got right this quarter. Revenues came in at $16.1 billion, beating consensus by about 12% and representing growth of 25% when compared to last year, the fastest rate of growth the company has seen in more than 15 years.
Data Center was its usual excellent self. It had revenue of $6.3 billion, growing by 59 percent, resulting in an operating profit of $2.5 billion, translating to a 40% operating margin. This is Intel's segment, and customers are committing to Xeon 6 processors and using Intel's full-stack solutions (CPU, networking, software, services) instead of AMD. The company did this while increasing the production of Blackwell for NVIDIA's GPU accelerators, which shows that Intel has good credibility with the hyperscalers on its foundry ambitions.
However, the Q2 win was bittersweet. Q3 revenue guidance was $15.8-$16.8 billion ($16.3 billion midpoint), which was below the $15.1 billion Street expectations at the time of the report. The raise was somewhat selective (Q2 beat; Q3 guide miss), and so management confidence is declining with each passing day of the quarter.
The Capex Burden Is the Story Behind the Story
This is where the void becomes clear. Intel upped full year 2026 capex expectations from $18B to $20B, representing a $2B increase to an already significant spend. Management expects further increases to capex in 2027. Despite a heavily loss generating $8.4B in adjusted free cash flow in Q2, they still reported $18.4B in capital expenditure.
Intel is currently funding this $18.4B run rate of capex with negative cash flow. Based on the current trajectory of capex and profitability, total available liquidity would be completely depleted in ~2-3 years. The company envisions that a greater scale in foundry revenue will outpace the ramp in capex, potentially allowing positive free cash flow to be generated around 2027 or 2028. This is a potential positive trajectory, but is far from guaranteed.
The Foundry Losses Are Still Enormous
The foundry segment as a new standalone business operating division to combat TSMC and Samsung, reported a 31% YoY revenue growth to $5.8B, with an operating loss of $2.1B. Each dollar of revenue cost Intel 36 cents in loss. Progress from last year's $3.2B loss is evident regarding loss narrowing, but that loss is still staggering. Customer revenue for the segment was a paltry $293 million compared to the significant external spending.
Management expects 14% growth in revenue for the foundry division in FY2027, bringing expected revenue to around $6.6 billion. Assuming a modest improvement in margins (loss shrinks to $1.5 billion), the division would still have a $1.5 billion annual cash drain. Investors wonder, how many years until foundry becomes profitable? Management cannot give a definite answer.
Client Stabilized, But Embedded Declining
Total Computing Segment revenue increased by 13% to $8.9 billion, and demand for high-end AI PCs remains strong. However, the Embedded segment had a negative performance. With the recent developments relating to customer segmentation, the portfolio has divided itself with the Data center segment showing significant growth, the Client segment holding steady, and Foundry and Embedded segments showing little to no growth.
Concentration risk has become more prevalent with Data Center bringing in almost 50% of total revenue. With such odds stacked against them, Intel is highly dependent on the Data Center customer segment and their capital expenditure cycle.
Technical Setup: Rejection at Trendline, Support Deteriorating
In the daily chart, Intel made an attempt to break the descending trendline around the $103 zone, which was quickly rejected. After the drop to $81.72 on July 29, the price shot up to $112.70 due to a suspected positive operational report from institutions. The stock price has retraced to $97.57, and the $95.68 support level is in danger of breaking.
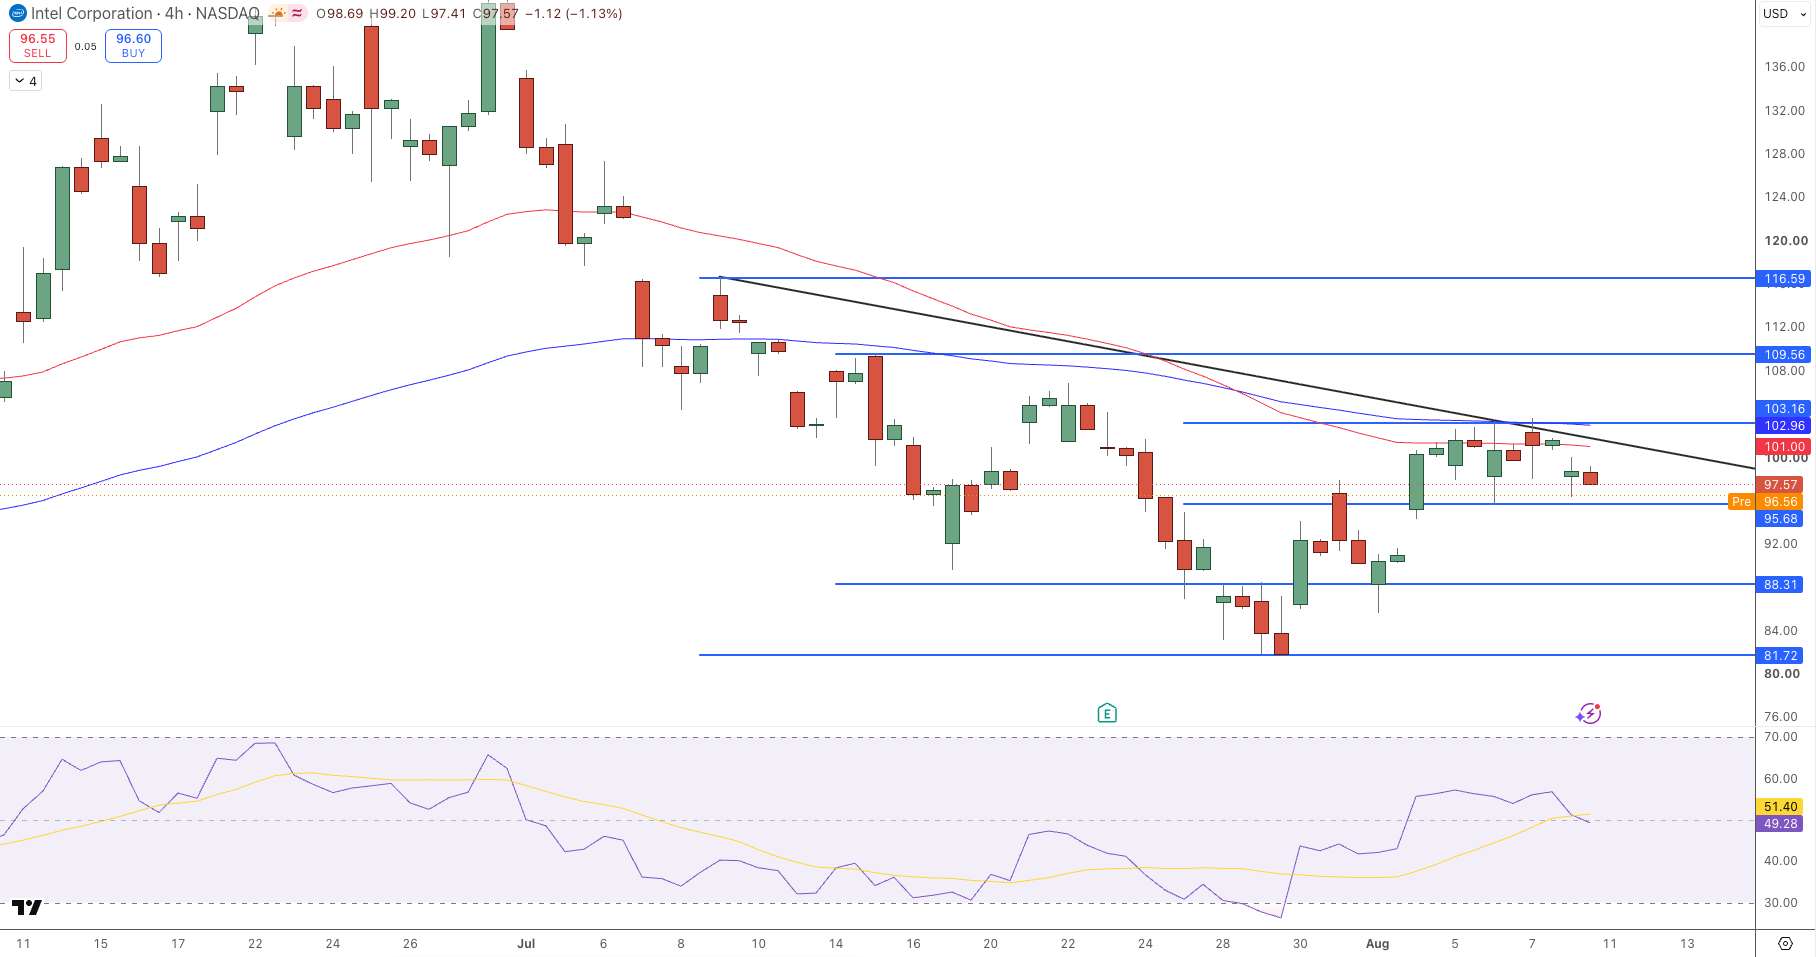
Intel's Price Chart - Source: Tradingview
After the drop to $101.00, the 50 day EMA level, and $102.96, the 100 day EMA level, are both in resistance. RSI is around 49 and has fallen below the neutral 50 level, as well as the signal line, and is now in a weak bullish region. A substantial break under $95.68 in the 4 hour chart will start the next major drop to $88.31, and then to the major support level at $81.72. For control of the bullish area to come back, a break of the descending trendline, around $101 - $1
Key Levels (Asian Session Aug 11)
- Immediate resistance: $101.00 (50 EMA)
- Major resistance: $102.96 (100 EMA), $103.16 (trendline), $109.56
- Extended targets: $116.59 (if trendline breaks)
- Critical support: $95.68 (must hold)
- Secondary support: $88.31, $81.72 (major floor)
- Current price: $97.57 (testing support)
- RSI: 49 (momentum fading)
Why Is the Stock Sinking If Data Center Is Strong?
Capital intensity has outpaced profits to the extent that off-the-charts operational metrics result in little to no positive impact for shareholders. While Intel’s data centers have impressive numbers (59% growth, 40% operating margins, and successfully winning customers away from AMD), that singular business is funding a $20+ billion annual expense for a highly unprofitable, capital intensive foundry and infrastructure. The numbersdon’t lie; earning only $2.5B from data centers while incurring an $2.1B loss on the foundry with $20B in capital expenses leaves Intel with a negative free cash flow and a depleting balance sheet.
The Valuation Disconnect
At a forward P/E of 49, Intel is trading at $97.57. That number suggests that despite estimated growth in revenue of 25%, the free cash flow outlook is still bearish. The stock will witness collections from the data centers, but increments in revenue will need to come without capex or the foundry will need to become profitable. While none of these numbers have materialized, management will need to cut the company’s expenses.
The Bottom Line
Intel was operationally strong in Q2 2026 with revenue growth of 25% and 59% growth in data center revenue with associated positive operating cash flow. This growth was overshadowed by capex of $18.4B (increased from last year), a negative adjusted free cash flow, $2.1B in foundry losses, and increased capex for 2027. The stock is reflective of the negative sentiment surrounding Intel as a company disproportionately investing in a loss-making foundry and core business.
Technically speaking, INTC is testing the lowest support zone around $95.68. RSI has dropped below 50, momentum is slowing, and the downward trendline is still providing resistance to any potential upside. A drop below $95.68 would bring $88.31 into support. In order for the bulls to regain control, they would need to move above $101 to $103.16 and break the downward trendline, which would give them a target of $109 to $116.
From a tactical perspective, the technicals look bearish with $95.68 being the key support level. From a financing perspective, until there is more clarity with regard to the foundry profitability or FCF (free cash flow) is significantly improved, it would be prudent to hold off on buying the stock. Again, this is analysis and not investment advice.
Recommended Articles







Comments (0)
Click the $ button, enter the symbol, and select to link a stock, ETF, or other ticker.