


CarMax Stock Forecast: Earnings Beat and Buyback Restart Put KMX Recovery in Focus



AI Podcast


CarMax reported strong fiscal Q2 results, with net sales rising 19.5% year-over-year to $7.88 billion and diluted EPS reaching $1.16, beating Wall Street expectations. Comparable retail unit sales grew 13%, driven by effective pricing and customer enhancements. Despite lower gross profit per unit, total gross profit increased 11.4% to $799.5 million, bolstered by improved SG&A expense leverage. Management announced plans to reinstate share repurchases in Q3. Auto Finance income rose 32.1% to $135.6 million, aided by lower loan loss provisions. Technically, KMX trades above its moving averages with an RSI of 57, eyeing upside targets at $62.25 and $63.43.
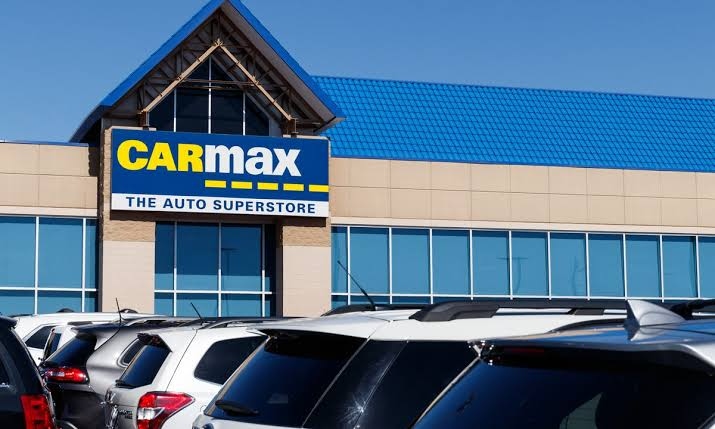
TradingKey - CarMax, Inc. (KMX) posted results for fiscal Q2 that point to continued progress against its stated objectives to return the business to long-term growth. Specifically, KMX reported comparable used unit sales growth of 13% and better than expected Q2 results. Subsequent to these results and the positive comparable used unit sales trend, KMX’s management team announced its intention to reinstate its share repurchase program. At this juncting, from a stock price and valuation perspective, KMX appears to be trading at reasonable levels with an upside potential given its improving operating results and the likelihood that its auto finance operations continue to improve.
Q2 Earnings Cleared the Immediate Test
Net sales/revenue increased 19.5% year over year to $7.88 billion and net earnings (after tax) increased 73.3% to $165.3 million. Diluted EPS increased to $1.16 from $0.64 in the prior year period. The quarter beat Wall Street expectations, with EPS above consensus of about $0.73 and revenue above estimates near 7.0-7.1 billion; these were not company records. Combined retail and wholesale unit sales increased by 14.7% to 387,735.
I believe the increase in unit volume was more important than any price or cost changes to their recent improvement in earnings. It is important to analyze this quarter as positive, unlike the last.
Comparable Retail Units Finally Turned Strongly Positive
Unit sales of vehicles that the Company retails increased by 13.8% to 227,391. Unit sales of Company-owned comparabled stores increased by 13.0%. I consider this to be the most positive information provided in this report. Comparable store retail unit sales decreased by 0.8% in the first quarter. A reduction in comparable unit retail sales of 0.8% was not positive, but a decrease of 0.8% compared to the first quarter of fiscal 2027 was a notable improvement. The unit retail sales volume information, along with the Company’s recent pricing strategies and enhancements to the customer experience and the products offered, should result in further improvement in sales of the Company. The question remains whether the Company can achieve and sustain this level of sales without continuing to take a negative change in the economy of its sold units.
Margin Pressure Is the Main Trade-Off
Decreases in gross profit per unit for both the retail and wholesale businesses resulted in an $111 decline in average gross profit per retail unit to $2,105 and a $135 decline in average gross profit per unit to $858, respectively. The decline in the average gross profit per unit, coupled with volume, positively impacted profitability. We believe CarMax’s focus is on increasing unit volume and gross profit, and taking a margin hit on each unit sold. Increasing unit volume, especially if fixed costs remain the same, can improve profitability. Evidence of this was observed in the second quarter. While gross profit per unit declined, total gross profit for the quarter increased 11.4% to $799.5 million. We believe continuing Unit volume growth while gross profit per unit declines would become concerning.
SG&A Leverage Strengthened the Earnings Story
Selling, general and administrative expenses for the second quarter increased 4.6% to $628.6 million. However, the average cost per unit sold, general and administrative expenses, decreased $157, or 8.8%, to $1,621. The focus for the company has been on growing unit volume to achieve positive cost absorption. The company has targeted $200 million in annualized SG&A exit-rate savings by the end of fiscal 2027 and has taken actions to reduce field and corporate payroll; it has not disclosed a 20% workforce-reduction target. The combination of greater unit volume and cost reduction initiatives provides further earnings upside.
Auto Finance Improved, but Some Help Was Nonrecurring
CarMax Auto Finance (CAF) income increased by 32.1% to $135.6 million for the quarter. The provision for loan losses declined to $113.4 million from $142.2 million a year ago. The decrease was partially offset by a $16.6 million gain on sale of auto loans and an increase in servicing fees. Generally speaking, given the reduction in credit costs, it is positive; however, considering the increase in average contract rates to 11.8% and a shift in the mix of loans toward a higher rate, Tier 2 loans, the finance division is warranting further evaluation. Ultimately, the decline in credit costs is favorable, but a more in depth analysis is warranted due to a potential increase in credit risk.
Buybacks Are Returning, but Management Is Staying Cautious
In a positive signal for the industry, CarMax announced they will resume share repurchases at a modest level in fiscal Q3; no shares were repurchased in fiscal Q2. As of the end of Q2, they had $1.31 billion authorized and available for repurchases. Management indicated they would repurchase shares if and when they saw positive signs in the business, and indicated they were seeing positive signs in Q1. As positive as all this may seem, keep in mind management intends to maintain a good level of financial flexibility. They are still in the process of further expanding their Tier 2 lending business, and completing the multi-year business transformation. As such, a large portion of their authorization could remain available for a long time.
Shift into GEAR Now Has Better Evidence Behind It
CarMax management has a strategy they refer to as Shift into GEAR. In Q2, they made strategy progress in a number of areas, including: offering an improved customer value proposition; Further simplifying and enhancing their digital and omni-channel customer shopping and fulfillment capabilities; and, strengthening the financial and operational performance and efficiency of their business, including further improving their gross margin per unit sold, and further SG&A cost and overhead structure and expense flexibility and savings. Officially, the four Shift into GEAR pillars are Great Offering, Easy Experience, Add Value and Run Lean. Based on this recent progress, several key elements of the strategy are advancing to the point where management can and should be judged on their strategy execution.
What Would Strengthen the Bull Case
My outlook has shifted to cautiously optimistic. More positive news would be improved same store sales by retail units. I would also want to see stability in gross profit per unit. Improving loan sale credit performance and a more durable interest margin would be less controversial. The November 3 update to the company’s strategy may provide color on growth initiatives. Potentially more pertinent would be the Company’s fiscal Q3 update on December 17. Improved results in Q2 could be indicative of improved trends, but the company has historically lumped strong quarterly results with weak quarters, and vice versa.
CarMax Technical Analysis: KMX Tests $59.47 Resistance After Trendline Breakout
CarMax's (KMX) recent close at $60.16, following an earnings related move, came after an intraday high of $63.67; it is not the highest level the stock has traded since June 2018. After breaking out above a long-term down trend line, the stock recovered and traded through the resistance zone of $59.26 to $59.47. Moreover, the stock is currently trading above both the 10 and 20- period moving averages. With the RSI reading of 57, slightly above the neutral level of 50, the reading suggests that the stock is not in an overbought condition.
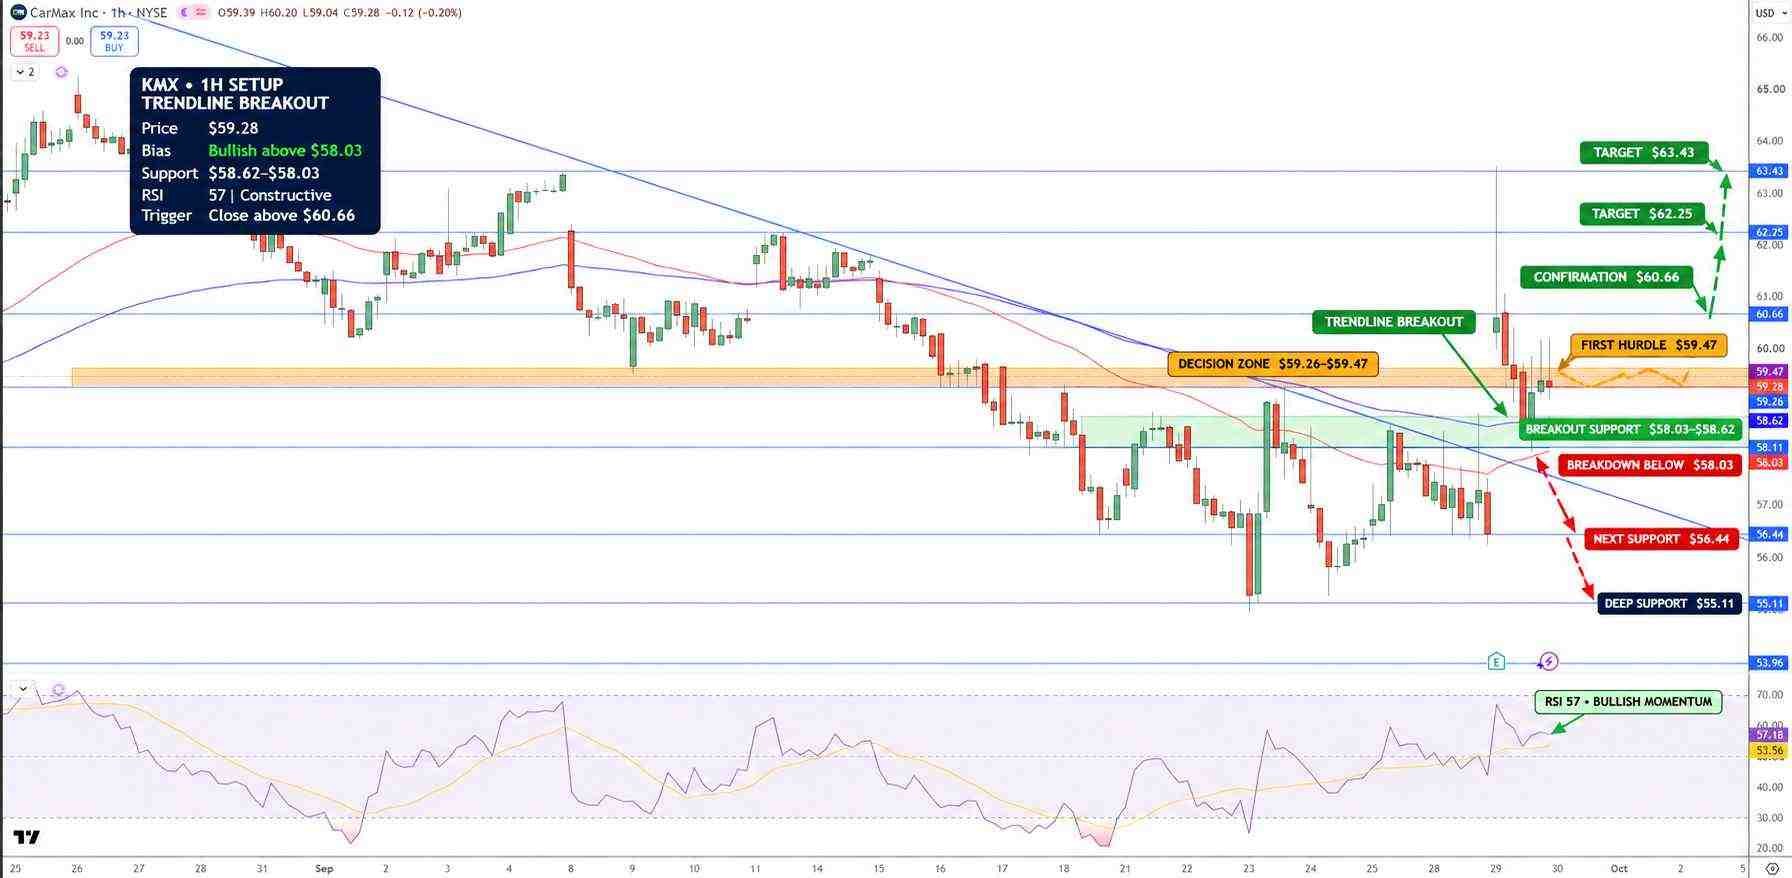
CarMax Stock Price Chart - Source: Tradingview
The next upside target is projected at $60.66. Should the stock recover to this level, additional upside would be projected at $62.25 and $63.43. On the downside, the $58.62 to $58.03 area, which is the area where the moving averages are located, is expected to provide support. A break below $58.03 would project downside toward the next support level at $56.44 and $55.11.
Key Levels
• Closest Level: $60.16
• Important Areas of Support: $58.62 to $58.03, $56.44, $55.11
• Important Areas of Resistance: $60.66 to $62.25, $63.43
• RSI: 57
• Potential Up Side Targets: $62.25 and $63.43
• Potential Down Side Targets: $56.44 and $55.11
Why is CarMax stock in focus now?
CarMax announced the results of quarter two, and the numbers showed a big increase in their comparable store units, and improved SG&A leverage despite a 4.6% increase in absolute SG&A expense, and increased earnings. The company also announced that they would resume share repurchases at a modest level in fiscal Q3.
What level confirms a stronger KMX recovery?
A continuation closing price above $60.66 would indicate that the resistance at this price had been removed. If this was the case, the price of KMX could rise to $62.25 and $63.43. A closing price below $58.03 would negate the breakout, and have traders looking for support at $56.44.
Bottom Line
Following Q2, CarMax reported significantly improved results. Comparable store units were strong. Earnings increased. The Company plans to resume share buybacks at a modest level in fiscal Q3. The Company's auto finance business benefitted from a gain on the sale of a loan. Generally, the automotive retailer and wholesaler gross profit per unit declined. For the next several quarters, CarMax will continue to be constructed at current levels. A breakout above $60.66 targets $62.25. A break below $58.03 would bring $56.44 into focus.
Recommended Articles









Comments (0)
Click the $ button, enter the symbol, and select to link a stock, ETF, or other ticker.