


Goldman Sachs (GS) Q2 2026 Earnings Preview: $14.47 EPS Expected, OpenAI IPO Candidacy, and the $1,067 Triangle Trigger



AI Podcast


Goldman Sachs reports Q2 2026 results today, with analysts projecting EPS of $14.20–$14.47 and revenue of $15.9–$16.49 billion, reflecting year-over-year growth but sequential moderation. Despite normalizing trading conditions, the firm benefits from strong EMEA M&A activity, potential lead roles in the OpenAI IPO, and $70 billion in new asset management mandates. Trading technically within a symmetrical triangle at $1,047, the stock faces a breakout trigger at $1,067. A potential dividend increase to $5.00 signals management’s confidence in sustained cash flow, though market volatility remains a primary risk factor for upcoming quarters.
TradingKey - Goldman Sachs Group (NYSE: GS) is set to announce its second-quarter 2026 results ahead of the market open this morning, July 14, 2026. The initial release is at 7:00 AM ET, followed by the conference call at 8:30 AM ET. Prior to the announcement, analysts had projected a Q2 2026 adjusted Earnings Per Share (EPS) of $14.20 to $14.47, or about 32% higher than last year's Q2 figures of $10.91, on total revenues of $15.9 billion to $16.49 billion, compared to $14.58 billion last year.
Goldman has surpassed the Zacks Consensus Estimate in each of the past four quarters, boasting an average EPS surprise of 13.10%. Currently, options are betting on an implied move of roughly 4.78% in either direction. The stock is currently trading at $1,047, within a symmetrical triangle and with an RSI approaching 50. A breakout above $1,067 would target $1,096 and $1,123, whereas a breakdown below $1,029 would expose the 200-period EMA at $1,014.
Why Q2 2026 Consensus Is Significantly Lower Than Q1
The $14.20 to $14.47 EPS range for the second quarter is down sharply from the record of $17.55 EPS reported in the first quarter. First quarter performance saw a sharp spike in total revenues to $17.23 billion from $14.58 billion the year before, an uptick analysts attributed to a rebound in equity trading. The second quarter consensus revenue forecast of $15.9 billion to $16.49 billion is below the $17.23 billion seen in the first quarter, or a sequential drop in total revenues of 7% to 8%, mostly as the trading environment normalizes.
The eight-thirty conference call will help investors determine if (1) investment banking fee revenue grew from the first quarter's strong recovery or if it started losing traction; (2) if the Asset & Wealth Management business can continue its first quarter growth of $4.08 billion, which was up 10% over the same period last year; (3) whether equities revenue normalised from Q1’s $5.33 billion toward the $4.0 to $4.5 billion range that would be consistent with a less-volatile Q2 trading environment, and; (4) whether operating expenses as a percentage of revenue declined from Q1’s $10.43 billion, which at 60.5% efficiency ratio left room for improvement.
Goldman has beaten Zacks estimates by 13.10% over the past four quarters; a similar upside against a $14.47 EPS consensus puts second quarter adjusted earnings close to $16.36.
OpenAI IPO Lead, the $70 Billion Mandate Wins, and a 19-Year High in EMEA M&A
Three factors ahead of today's release help frame the medium term revenue outlook outside of the second quarter print. Goldman's M&A in EMEA reached its highest point in 19 years in the first half of 2026, accounting for 44% of all deal value in the region, and confirms that Goldman is taking a larger share of M&A deals in the most lucrative deal environment since 2007.
Goldman Sachs and Morgan Stanley are among the two leading prospects to manage the anticipated OpenAI Initial Public Offering (IPO), which would be a source of underwriting revenues that would be in excess of any normal quarter's equity underwriting. Goldman's equity underwriting revenues in the first quarter were $535 million; the OpenAI mandate, should it go through as projected, could produce fee revenues that dwarf this quarterly figure, making it the most significant single event to impact Goldman's third or fourth quarter consensus forecasts.
Goldman's Verizon and Lockheed Martin Institutional Retirement Plan mandates, totaling some $70 billion, would be the first tangible milestone of the company's 2030 target for $750 billion in asset under management in the AWM business line, set by David Solomon.
Recurring, fee-based revenues from stable institutional assets that aren't subject to redemption in volatile markets would serve as the counterbalance to the cyclical revenue model inherent in the investment banking and trading businesses. If, in the coming days, the board of directors confirms that a sufficient capital cushion is available post-second quarter earnings, Goldman Sachs will be increasing its dividend payout from $4.50 per quarter to $5.00 per quarter, an indication that it expects its free cash flow generation to be able to sustain this increased dividend payout indefinitely
GS Chart Analysis: Symmetrical Triangle at $1,047, RSI 50, Breakout Trigger $1,067
On the 4H timeframe, Goldman Sachs is at $1,047 in a consolidation near the apex of the symmetrical triangle after declining from the June top of $1,110. The RSI is currently at a neutral 50. The 200-period EMA sits at $1,014. A breakout above $1,067 opens targets of $1,096 and $1,123.
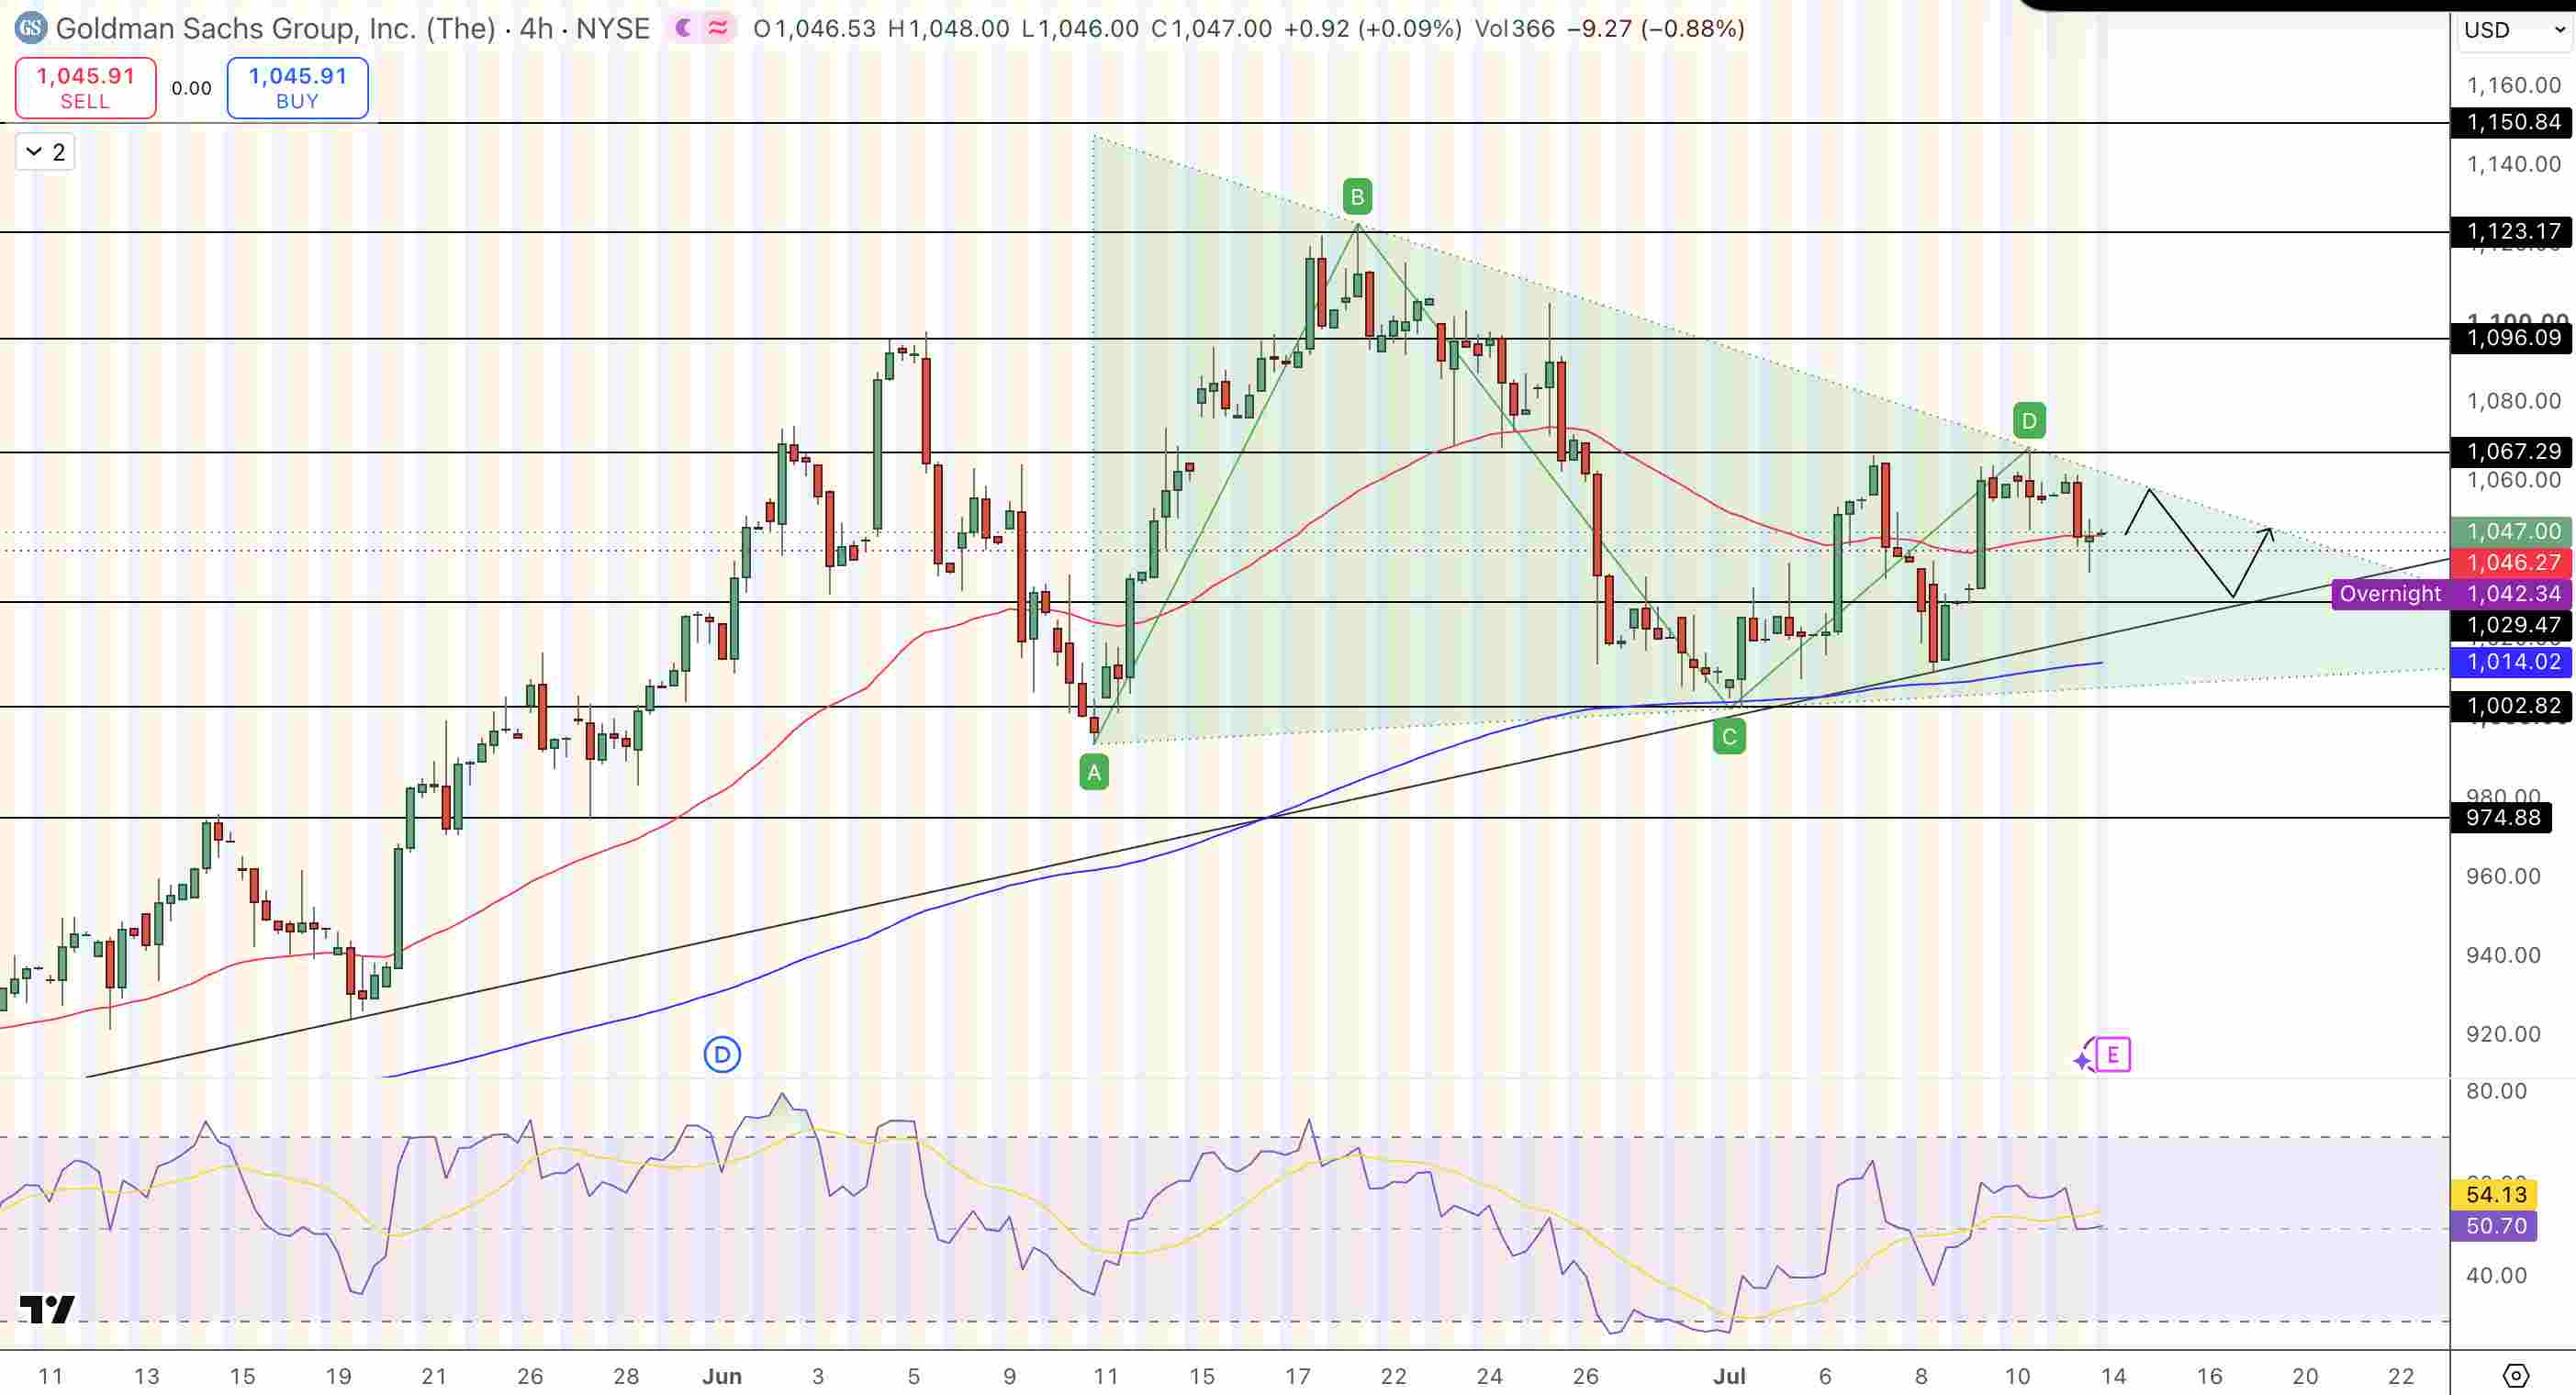
Goldman Sachs (GS) Price Chart - Source: Tradingview
A close below $1,029 exposes the 200-period EMA at $1,014 and potentially $1,003. Q2 earnings are key to whether the triangle completes as a bull signal or sideways price action.
- Breakout trigger: $1,067, upper boundary of triangle
- Target 1: $1,096, measured move of the triangle
- Target 2: $1,123, recent high from June
- Bear trigger: Close below $1,029, 200 EMA at $1,014 is exposed
- Q2 Consensus: $14.20 to $14.47 EPS, +30% to 33% YoY. Revenue $15.9B to $16.49B
- Key Catalysts: OpenAI IPO Lead, $70B Asset & Wealth Management (AWM) mandate wins, 19 year high in EMEA M&A
What Is Goldman Sachs Expected to Report for Q2 2026?
Goldman will report its Q2 2026 results at 7:00 a.m. ET this morning. The Street is looking for an earnings per share between $14.20-$14.47, which would be a 30% and 33% gain compared to $10.91 in Q2 2025. The consensus is for revenue of between $15.9 billion and $16.49 billion, versus $14.58 billion in the year-ago quarter. This would mean that earnings will pull back from $17.55 in Q1 and revenue from $17.23 billion.
The lower quarter-over-quarter growth rates should reflect calmer equity market conditions than the prior quarter. Goldman tends to be a surprise stock and has come in up 13.10% on average over the past four quarters.
What Strategic Deals Matter Beyond the Quarterly Numbers?
Here are three things:
- Goldman Sachs' Middle East, Europe and Africa M&A advised deals for the first half of 2026 reached a 19-year high of a 44% market share.
- Goldman Sachs and its rival, Morgan Stanley, are thought to be the favorites to lead on OpenAI's pending IPO. Such a deal would bring in huge underwriting fees and boost the third and fourth quarter consensus.
- The acquisition of Verizon and Lockheed Martin accounts for $70 billion of new retirement plan mandates. That adds to Goldman's ability to reach its goal of $750 billion in alternatives AUM by 2030 and also provides a larger recurring stream of fees, which would insulate Goldman from the ebb and flow of trading revenue.
What Happens to GS Stock if It Beats vs Misses Consensus?
The options market is pricing in a 4.78% move on the news. If Goldman beats and surprises like it usually does (by 13.10%) and hits $16.00 and $16.36 of earnings, then there is a strong chance we could see a break out above the top of the symmetrical triangle at $1,067. The price is then seen for $1,096 before the next resistance level of $1,123, a level reached back in June.
At a neutral outcome where Goldman simply hits consensus estimates, the triangle will stay intact while the stock remains indecisive until the quarterly conference call. If Goldman misses or strikes up a cautious tone regarding future investment banking pipelines, then the downside is for $1,029 to see how many sellers come into the market below $1,014, the 200-period EMA.
Bottom Line
Goldman Sachs' earnings will be released today at 7:00 a.m. ET in comparison with $14.20 to $14.47 (+30% YoY) EPS and $15.9 to $16.49 billion consensus revenue. Goldman's trailing average earnings surprise of 13.10% offers a statistical underpinning to the bull case. A 19-year high for EMEA M&A, being the front-runner to IPO OpenAI, and $70 billion in wins for Asset & Wealth Management are the longer-term structural catalysts outside the quarterly earnings result. Goldmann Sachs is at $1,047 within a symmetrical triangle; it could run for $1,096 (and $1,123), once it moves above $1,067. A breach below $1,029 is the trigger for the 200-EMA at $1,014. The dividend was increased from $4.50 to $5.00, subject to approval by the board today.
Recommended Articles







Comments (0)
Click the $ button, enter the symbol, and select to link a stock, ETF, or other ticker.