


Costco (COST) Stock Price Forecast: June Sales Up 10.6% But Stock Fell After Hours - Short to $899?



AI Podcast


Costco reported strong June results, with net sales rising 10.6% to $29.24 billion and comparable sales increasing 8.8%. Despite robust membership growth and an 89.7% renewal rate, the stock remains stagnant as investors have already priced in high growth at a 42x forward P/E ratio. Technically, the stock faces resistance between $967 and $982. With limited upside surprise, market attention shifts to the September 25 Q4 FY2026 earnings for signs of sustained demand and FY2027 guidance. The current valuation suggests that exceptional operational performance is now a baseline expectation rather than a catalyst for further appreciation.
TradingKey - Following a surge in June sales, Costco Wholesale (NASDAQ: COST) changed hands for $942.41, though the market reaction was fairly muted. In the five-week period ending July 5, Costco delivered net sales of $29.24 billion, increasing 10.6% compared to the prior year. On a comparable basis, sales increased 8.8%, with e-commerce transactions up 20.9% year-over-year. The Board of Directors also announced a quarterly dividend of $1.47 per share which will be paid August 7.
Another month of double-digit sales results only pushed the stock 0.6% higher during July 8 sessions before retreating 1.5% on after-hours trading. Below a falling trendline on the 2H chart, COST has resistance at the $967-$982 level. RSI is 54.32. Investors will now look for signs of sustainability, perhaps in the upcoming Q4 FY2026 results on September 25, for evidence that Costco can sustain its growth while supporting its premium valuation.
June Sales Continue to Show Strong Consumer Demand
June sales results showed the ongoing trend of growth that was established throughout FY2026. Costco delivered net sales of $29.24 billion, with comparable sales up 8.8% (9.8% in Q3). During the first 44 weeks of the FY, Costco generated net sales of $250.43 billion (up 10.1%), with comparable sales gaining 8.3% year-over-year.
Ecommerce sales were up 20.9% on the month, following a number of quarters of strong growth. Full year revenues will land between $290-$295 billion.
It is understandable, then, why shares reacted so mutedly to strong June results. At a 47.8x trailing 12-month P/E and 42x forward earnings, this market expects double digit sales growth to continue unabated. Costco has done a good job showing that it can grow, but that is not sufficient to push the price back up to its $1,096.32 52-week high.
Membership Growth Remains Costco's Competitive Advantage
Costco's membership operations continue to offer steady cash flow, with consistent growth in the number of paid members and high renewal rates.During the quarter, paid membership rose 4.1% from a year earlier to 82.9 million members, while Executive memberships surged 9.6% to 41.2 million members. The company's renewal rate reached 89.7% worldwide and 92.2% in the United States and Canada, the 11th straight year it has posted a global renewal rate above 89%. Membership fees generated $1.373 billion in sales during Q3 FY2026, 10.7% higher than last year. Membership dues provide Costco with reliable recurring profits with which to finance its operations and keep merchandise margins low.
The question for investors isn't whether or not Costco can execute; it's just what that stock is worth. While many strategists have described Costco as a high quality retailer, others have pointed out that investors might already have priced in that quality
COST Technical Analysis: Key Levels to Watch
On the 2H chart, COST continues to trade below descending trendline resistance between $967 and $982, with repeated rejection from that area confirming selling interest. RSI remains neutral at 54.32. Support is located between $924.13 and $911.56.
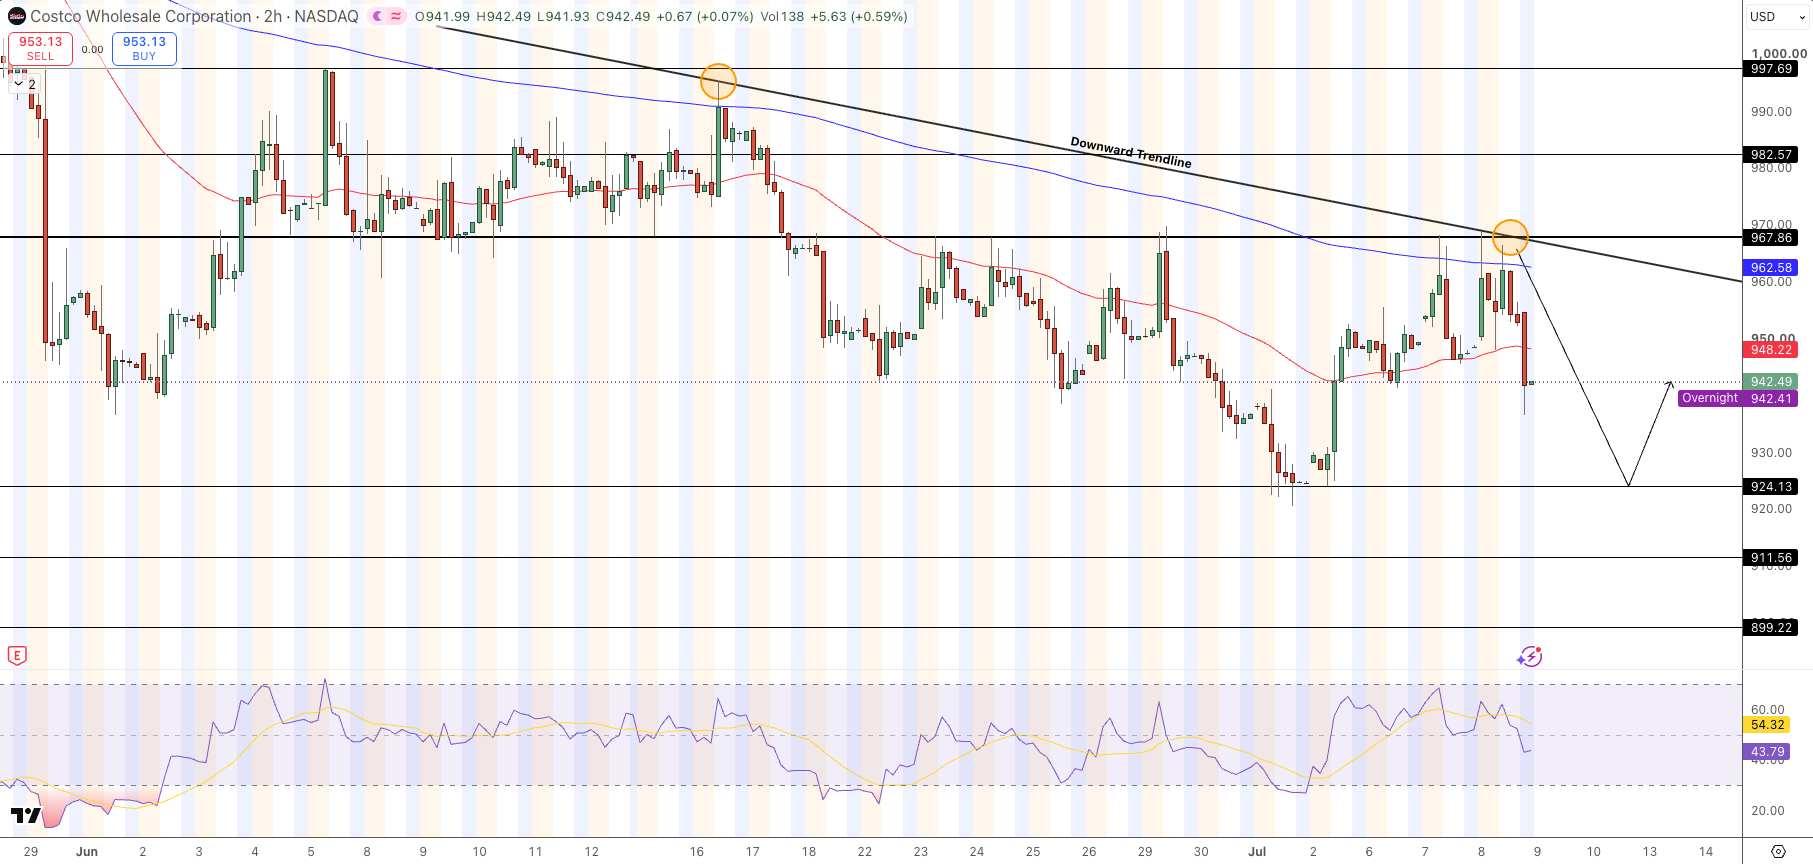
Costco (COST) Stock Price Chart - Source: Tradingview
- Short entry: Below $924.10
- Target: $899.20
- Stop loss: Close above $967.80
A sustained close above $967.80 would weaken the current bearish structure and shift attention toward $982–997.
Key Catalysts
- June sales: $29.24B (+10.6% YoY), comparable sales +8.8%, digital sales +20.9%
- Dividend: $1.47 per share, payable August 7, 2026
- Q4 FY2026 earnings: Expected around September 25
Why Did Costco Stock Fall Despite Strong June Sales?
While another monthly surge in sales was posted by Costco, in general they met the investors' expectations. Already costing at 40 plus times forward earnings; the market already prices in consistent high-single to low-double-digit growth. And lacking in the last release an upside surprise, there was no need for investors to increase the valuation multiple.
Is Costco's Membership Business Still Growing?
Yes, it is still growing. The company still has a great moat around its paid membership numbers. With 82.9 million paid memberships and 41.2 million Executive memberships. Renewal rate still above 89% worldwide, membership fees are still in the double digit range for annual growth and recurring income.
What Should Investors Watch at Costco's September Earnings?
Comps (comparable sales) are probably going to be the big thing to see again if they can continue to grow at the high single digit pace they had for the majority of FY2026, or if consumers are starting to pull back. Growth in membership fees. Executive membership penetration rate. Guidance from Management for FY2027.
Bottom Line
Costco continues to produce excellent results with June's sales up 10.6%, comps up 8.8% and e-commerce sales 20.9% up, but at this elevated stock price multiple alone this type of performance wasn't enough to move the stock higher. On the technical side, it is still below resistance with September's earnings to confirm if we are going to continue with the current chop or return back to the longer-term trend higher.
Recommended Articles










Comments (0)
Click the $ button, enter the symbol, and select to link a stock, ETF, or other ticker.