

S&P 500 Total Market Value Is About to Surpass $70 Trillion, Is There a Bubble? When to Buy to Ensure Relative Safety?


AI Podcast
The S&P 500's record highs in 2026 are driven by a few AI leaders, with the broader index showing weakness. High valuations, evidenced by a Shiller P/E of 42.32 and a Buffett Indicator of 237%, echo dot-com bubble extremes. While bulls cite AI-driven earnings growth, bears point to slow adoption rates and market pricing that outpaces fundamental improvements. Historical parallels suggest potential for a bubble burst, exacerbated by hawkish monetary policy and rising interest rates. Investors may consider phased entry upon a Shiller P/E below 30x, explicit Fed rate cut signals, or a 10-15% market correction.
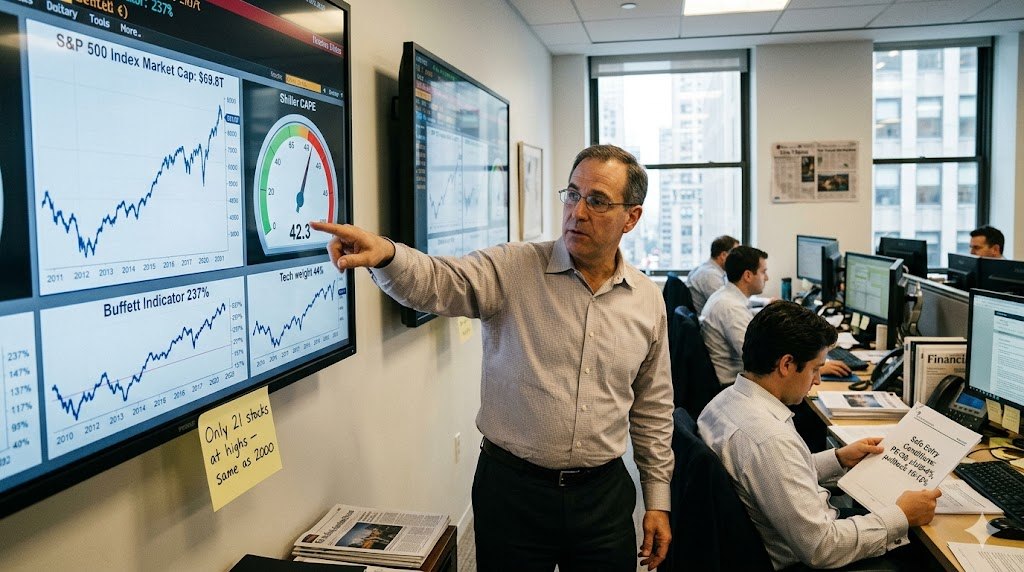
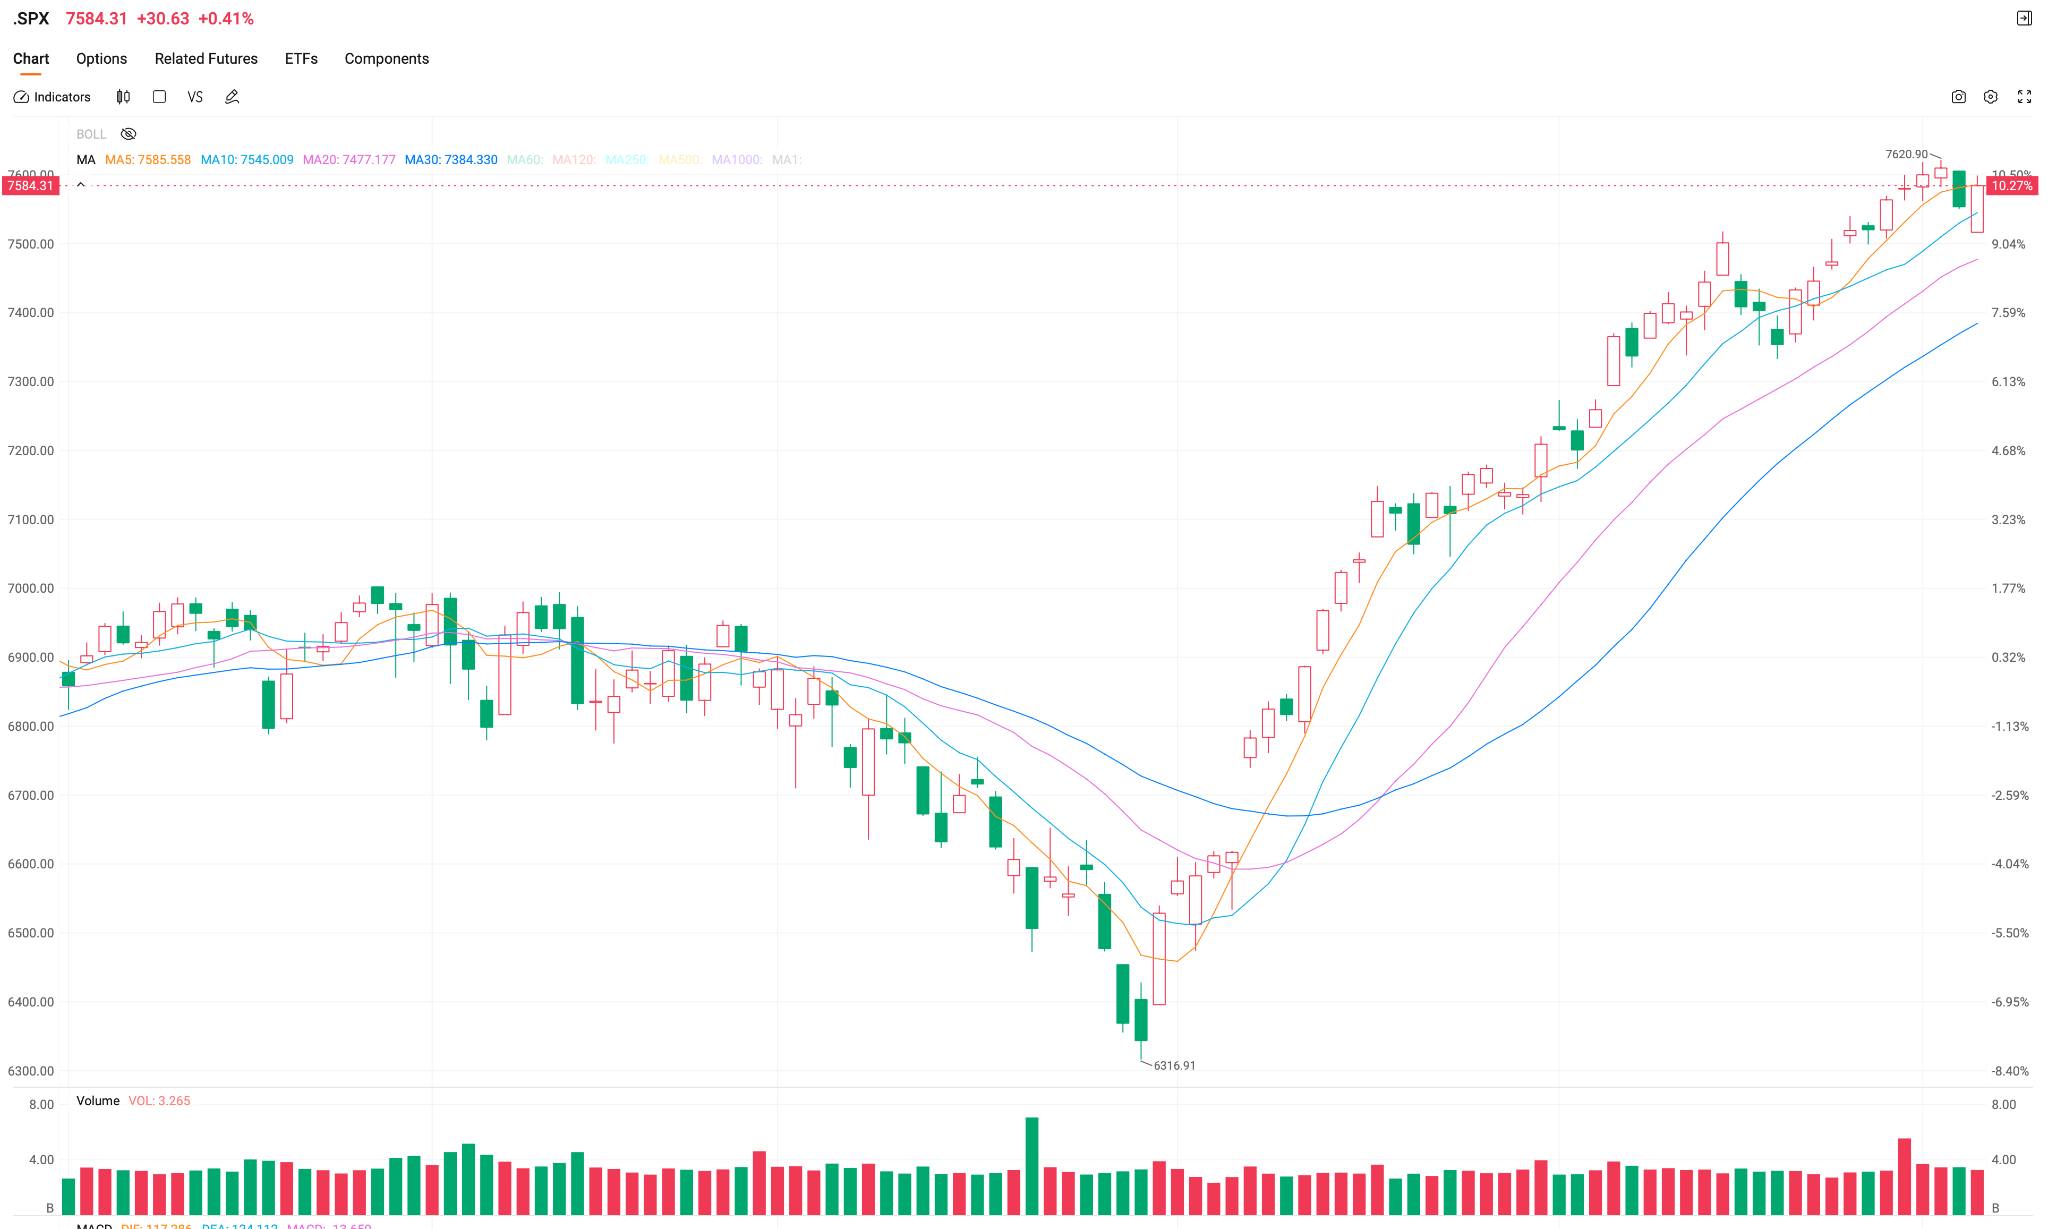
TradingKey - In 2026, the S&P 500 index has repeatedly set new record highs. As of the close on June 2 ET, its total market capitalization surpassed $69 trillion, with a cumulative year-to-date increase of over 10%.
However, the index's resilience is highly dependent on a few AI leaders. Excluding the top companies benefiting from AI computing demand, the S&P 500 has actually trended slightly lower since late February, whereas the overall index rose by about 10% and AI beneficiary sectors surged by over 45% during the same period.
The tech sector now represents nearly 44% of the S&P 500 weight, and the top ten constituents account for a combined weighting of approximately 41%, compared to only 19% a decade ago. The gap between weighting and expected earnings contributions has expanded to historical extremes.
NVIDIA alone has accounted for nearly a quarter of the S&P 500's year-to-date gains, and its market capitalization now exceeds the combined value of all major pharmaceutical giants. Internal divergence among constituents is even more extreme: 222 S&P 500 stocks are down more than 20% from their historical highs, and 109 are down over 40%, while only 21 stocks are currently at all-time highs—nearly identical to the 20 stocks at the peak of the 2000 dot-com bubble.
Warning signals emerge simultaneously.
The Shiller P/E ratio (Cyclically Adjusted Price-to-Earnings ratio) has climbed to 42.32, approaching its historical peak of 44.19 recorded just before the dot-com bubble burst.
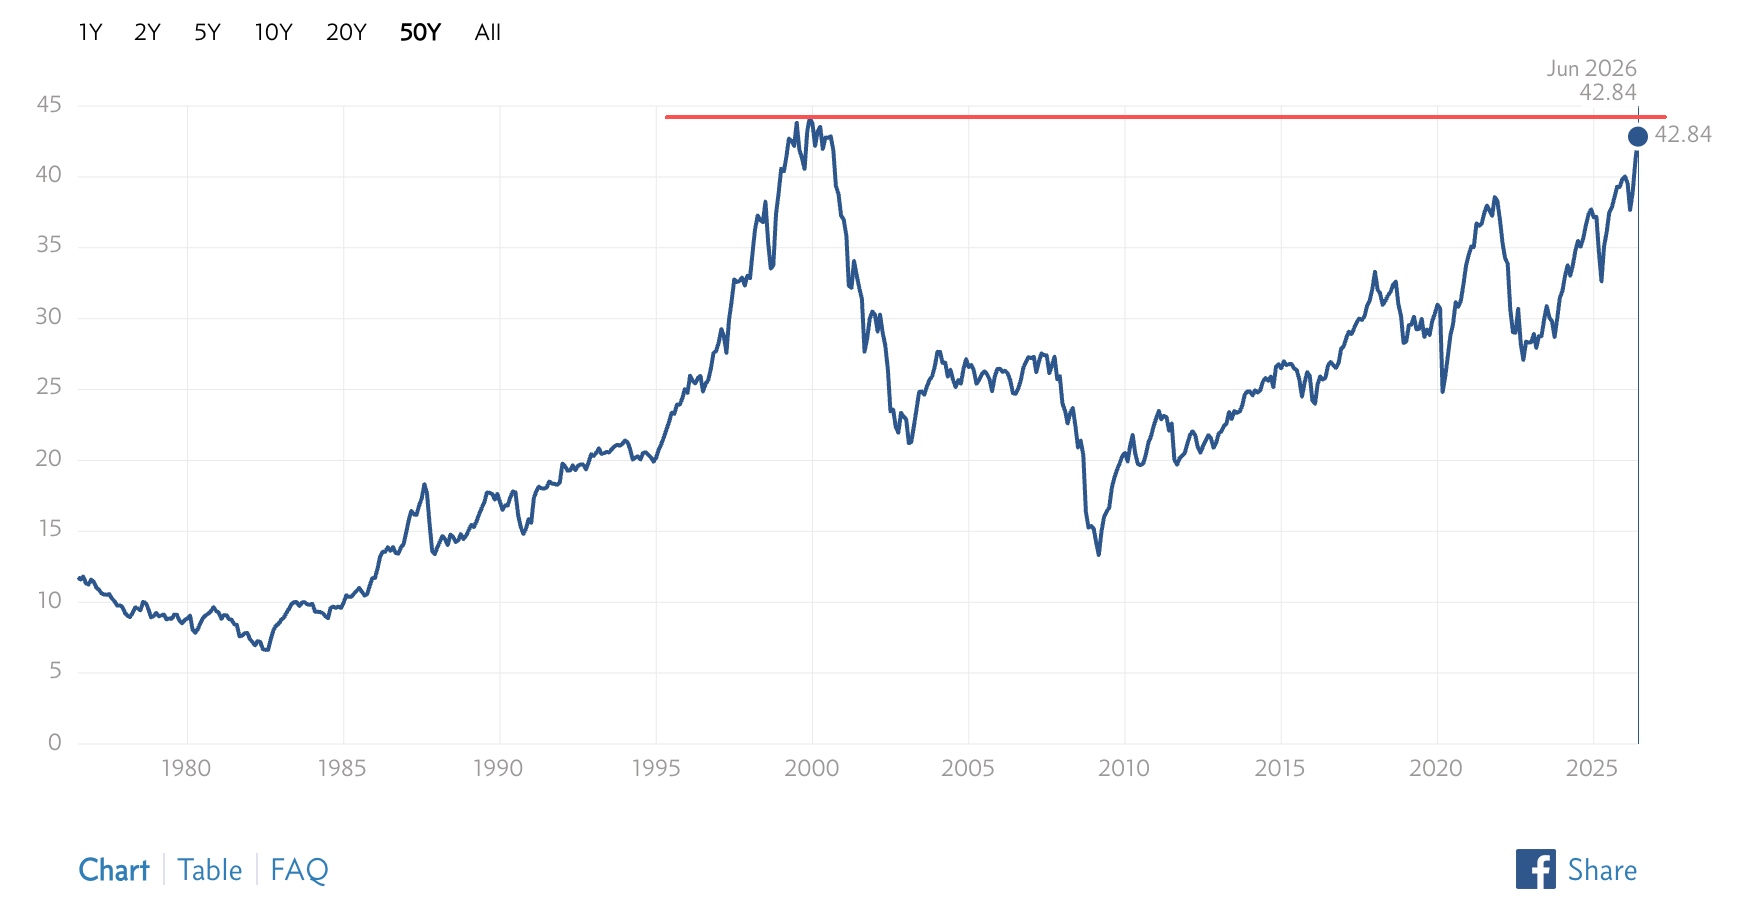
[Shiller P/E Ratio Approaches Dot-com Era Historical Peak; Source: TradingKey]
There have been only two periods in history when such highs were reached: the eve of the Great Depression in 1929 and the dot-com bubble in 2000. Based on these calculations, the annualized return over the next 10 years may be only around 2%.
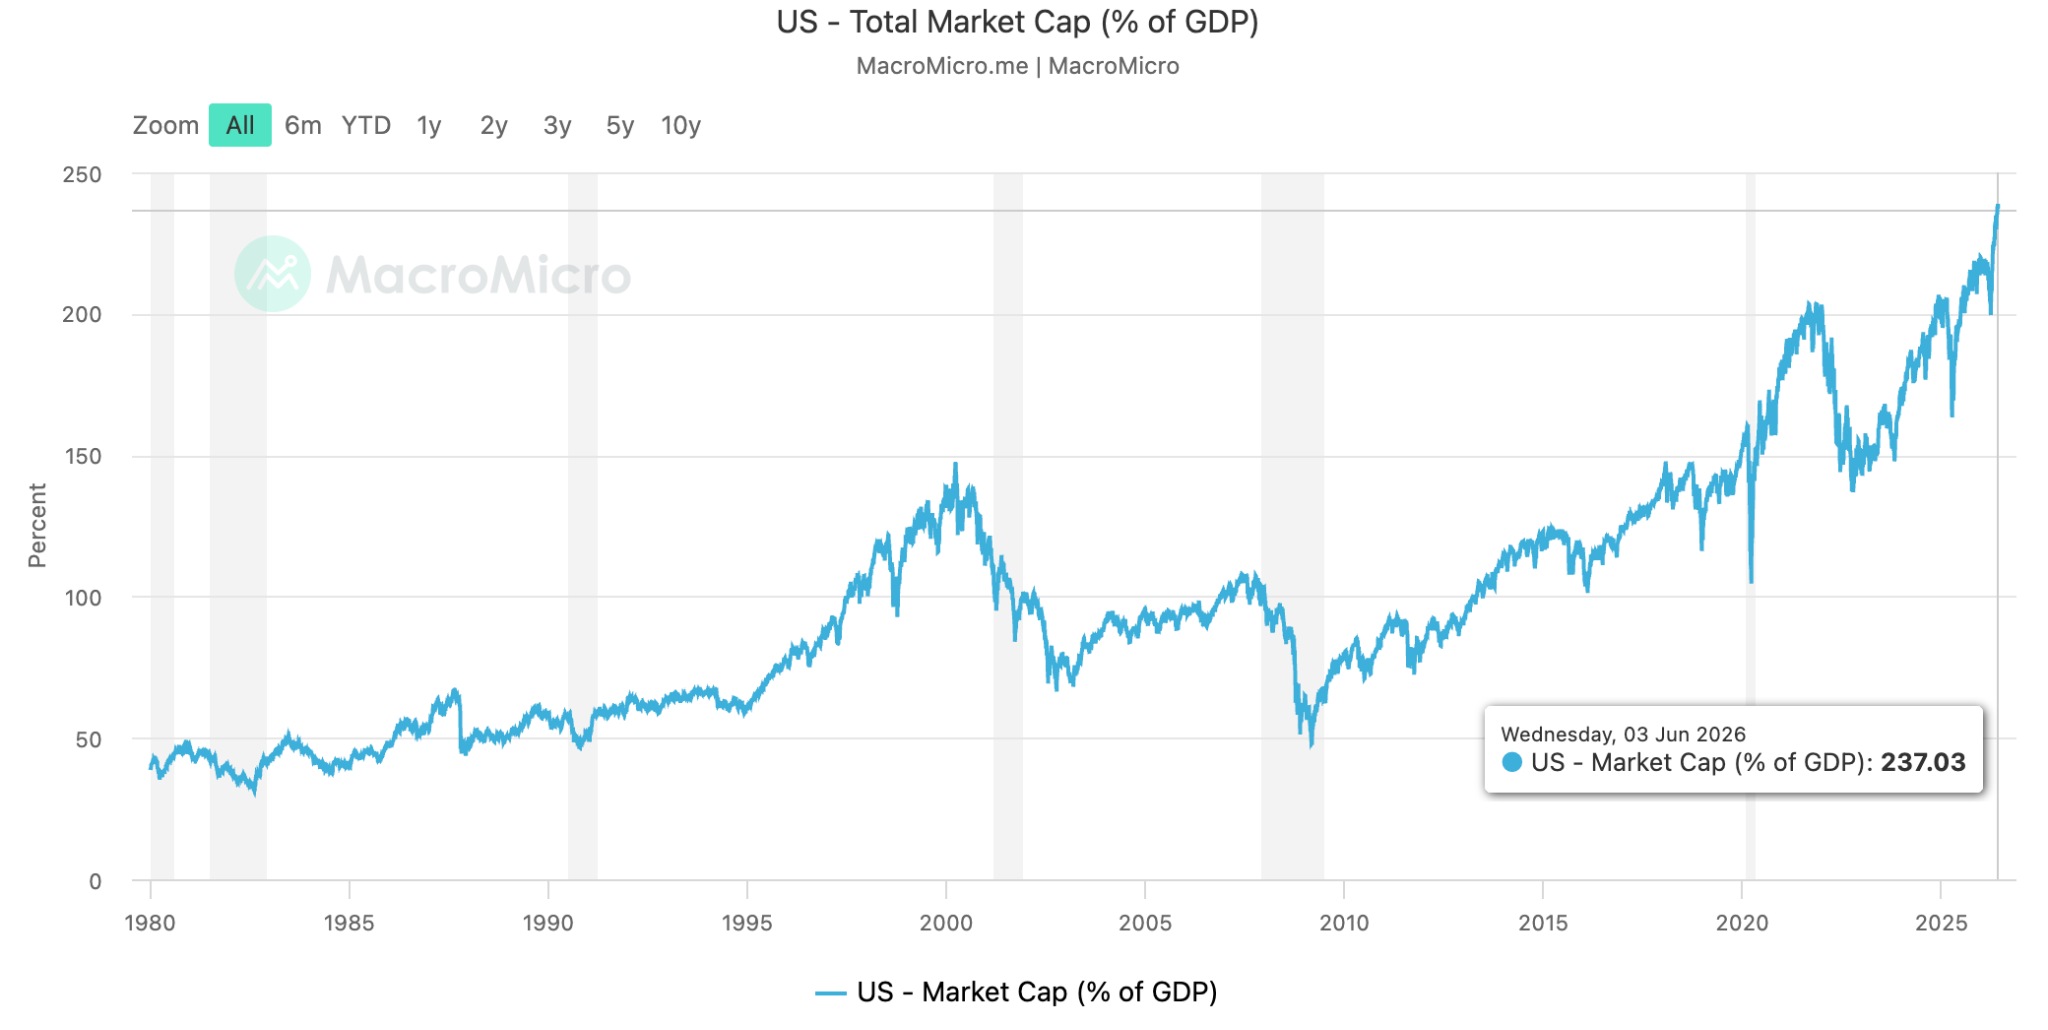
[Buffett Indicator Continues to Set New Highs; Source: MarcoMicro]
Meanwhile, the Buffett Indicator has soared to 237%, far exceeding the peaks of the previous two bubbles (approximately 142% in 2000 and 218% in 2021). Warren Buffett once described this indicator as the best single measure of valuation and warned that a reading exceeding 200% approaches speculative overheating.
Furthermore, only about 4% of stocks in the S&P 500 are at historical highs, a proportion that almost perfectly aligns with the peak of the dot-com bubble in 2000; 85% of individual stocks have underperformed the index in annual gains, reflecting an intensifying disconnect between advancing and declining stocks.
Earnings Support and Bubble History
The debate between bulls and bears centers on whether this AI-driven structural rally will ultimately culminate in a bursting bubble, whereas bulls argue that AI has effectively translated into a definitive source of earnings growth.
The bullish argument focuses on earnings visibility. In the first quarter of 2026, AI-related earnings are projected to grow by 40.7%, approximately triple that of the rest of the S&P 500 components. Full-year earnings growth for the S&P 500 in 2026 is expected to exceed 20%, with the majority contributed by tech giants.
Furthermore, the tech sector's current forward P/E ratio is approximately 35.6x, compared to as high as 50x during the dot-com bubble of 2000. The earnings foundation is also vastly different, as current AI leaders possess robust cash flows and strong profitability.
Bearish concerns point to the disconnect between lagging AI adoption rates and excessive valuations. As of May 2026, the actual AI adoption rate among U.S. enterprises was only 19.8%, with expectations for only a slight increase to 22.8% over the next six months.
The pace of actual AI implementation in enterprises is significantly slower than what capital market pricing anticipates. Goldman Sachs data shows that as of March 2026, only about 19% of U.S. companies had actually deployed AI. Bank of America estimates that the peak annualized boost from AI to total factor productivity is only 0.1 to 0.6 percentage points, with an impact cycle exceeding ten years. Current market valuation premiums are clearly pricing in a faster and more widespread productivity revolution, suggesting that valuation expansion has outpaced the actual capacity to digest fundamental improvements.
Representing the bears, Bank of America Chief Strategist Michael Hartnett has called this AI bubble the largest since the 19th-century railway bubble. He believes that central bank policies and persistently rising interest rates will eventually terminate the current rally, and he has outlined investment strategies for investors following a potential bubble burst.
Historical precedents offer another layer of reference. In the 1970s, the "Nifty Fifty" stocks were similarly lauded for having the strongest profitability and most stable business models; however, when the interest rate environment reversed, none were spared from the crash despite their genuine earnings. Currently, U.S. Treasury yields are nearing the critical 4.5% valuation threshold, a level that historically triggers systemic valuation compression for tech stocks once breached.
Historically, instances where the S&P 500 gained more than 15% over two consecutive months have occurred only four times, each during a major bull market. The difference this time is that the rally has not been accompanied by a broad-based improvement in earnings. Instead, it relies heavily on the exceptional performance of a few AI beneficiaries, with market breadth narrowing to an extremely rare historical range.
Goldman Sachs has raised its year-end target for the S&P 500 to 8,000, yet significant uncertainty remains regarding whether AI capital expenditure can consistently translate into earnings. The AI revolution is still in its early stages, yet technical indicators have generally entered high historical percentiles.
The new Federal Reserve Chair Warsh is known for his hawkish stance, and the market now prices in a more than 80% probability of rate hikes by the end of 2026. This interest rate backdrop creates a potential structural mirror image of the macro tightening environment seen during the bursting of the bubble in 2000.
When to buy to ensure relative safety?
Strictly speaking, there is no such thing as a guaranteed safe entry point in the stock market, but there are relatively safe allocation zones. Based on current valuation, macroeconomic, and sentiment indicators, investors may consider building positions in appropriate beneficiary assets in phases once the following conditions are met.
First, the Shiller P/E ratio falls below 30x. The current reading of 42.3x is already at a historical extreme; a correction to 30x—while still above historical means—would significantly alleviate bubble pressures and notably improve the margin of safety.
Second, the Federal Reserve explicitly signals rate cuts or the 10-year U.S. Treasury yield retreats below 4%. The current 4.5% yield exerts systemic pressure on tech stock valuations; once an interest rate pivot is confirmed, the fragility of high-multiple assets should subside.
Third, the market undergoes a relatively deep correction (10% to 15%). History suggests that mid-term adjustments within a major bull market often provide superior entry windows. For retail investors, rather than attempting to time the bottom, it is more effective to use dollar-cost averaging into beneficiary assets or broad-based indices (such as the S&P 500 Equal Weight ETF) to mitigate the timing risks of lump-sum investing.
At this stage, maintaining a cash reserve and waiting for one of the aforementioned signals before building positions in tranches may be a more prudent strategy. As BofA’s Hartnett noted, investment opportunities following a bubble burst are typically reserved for those with patience and discipline.
This content was translated using AI and reviewed for clarity. It is for informational purposes only.
Recommended Articles


Comments (0)
Click the $ button, enter the symbol, and select to link a stock, ETF, or other ticker.