

AUD/USD establishes short-term uptrend and next targets the 200-period SMA


- AUD/USD reversed off the August 5 lows and struck higher, establishing a new uptrend.
- The pair could even see further gains up to the 200-period SMA in the 0.6630s.
AUD/USD has probably reversed its short-term downtrend since the recovery from the August 5 lows and will continue extending higher.
The pair rebounded from the early August lows, forming a typical trend reversal marker in the form of a long Japanese Hammer candlestick pattern on both the 4-hour (circled below) and daily chart (not shown).
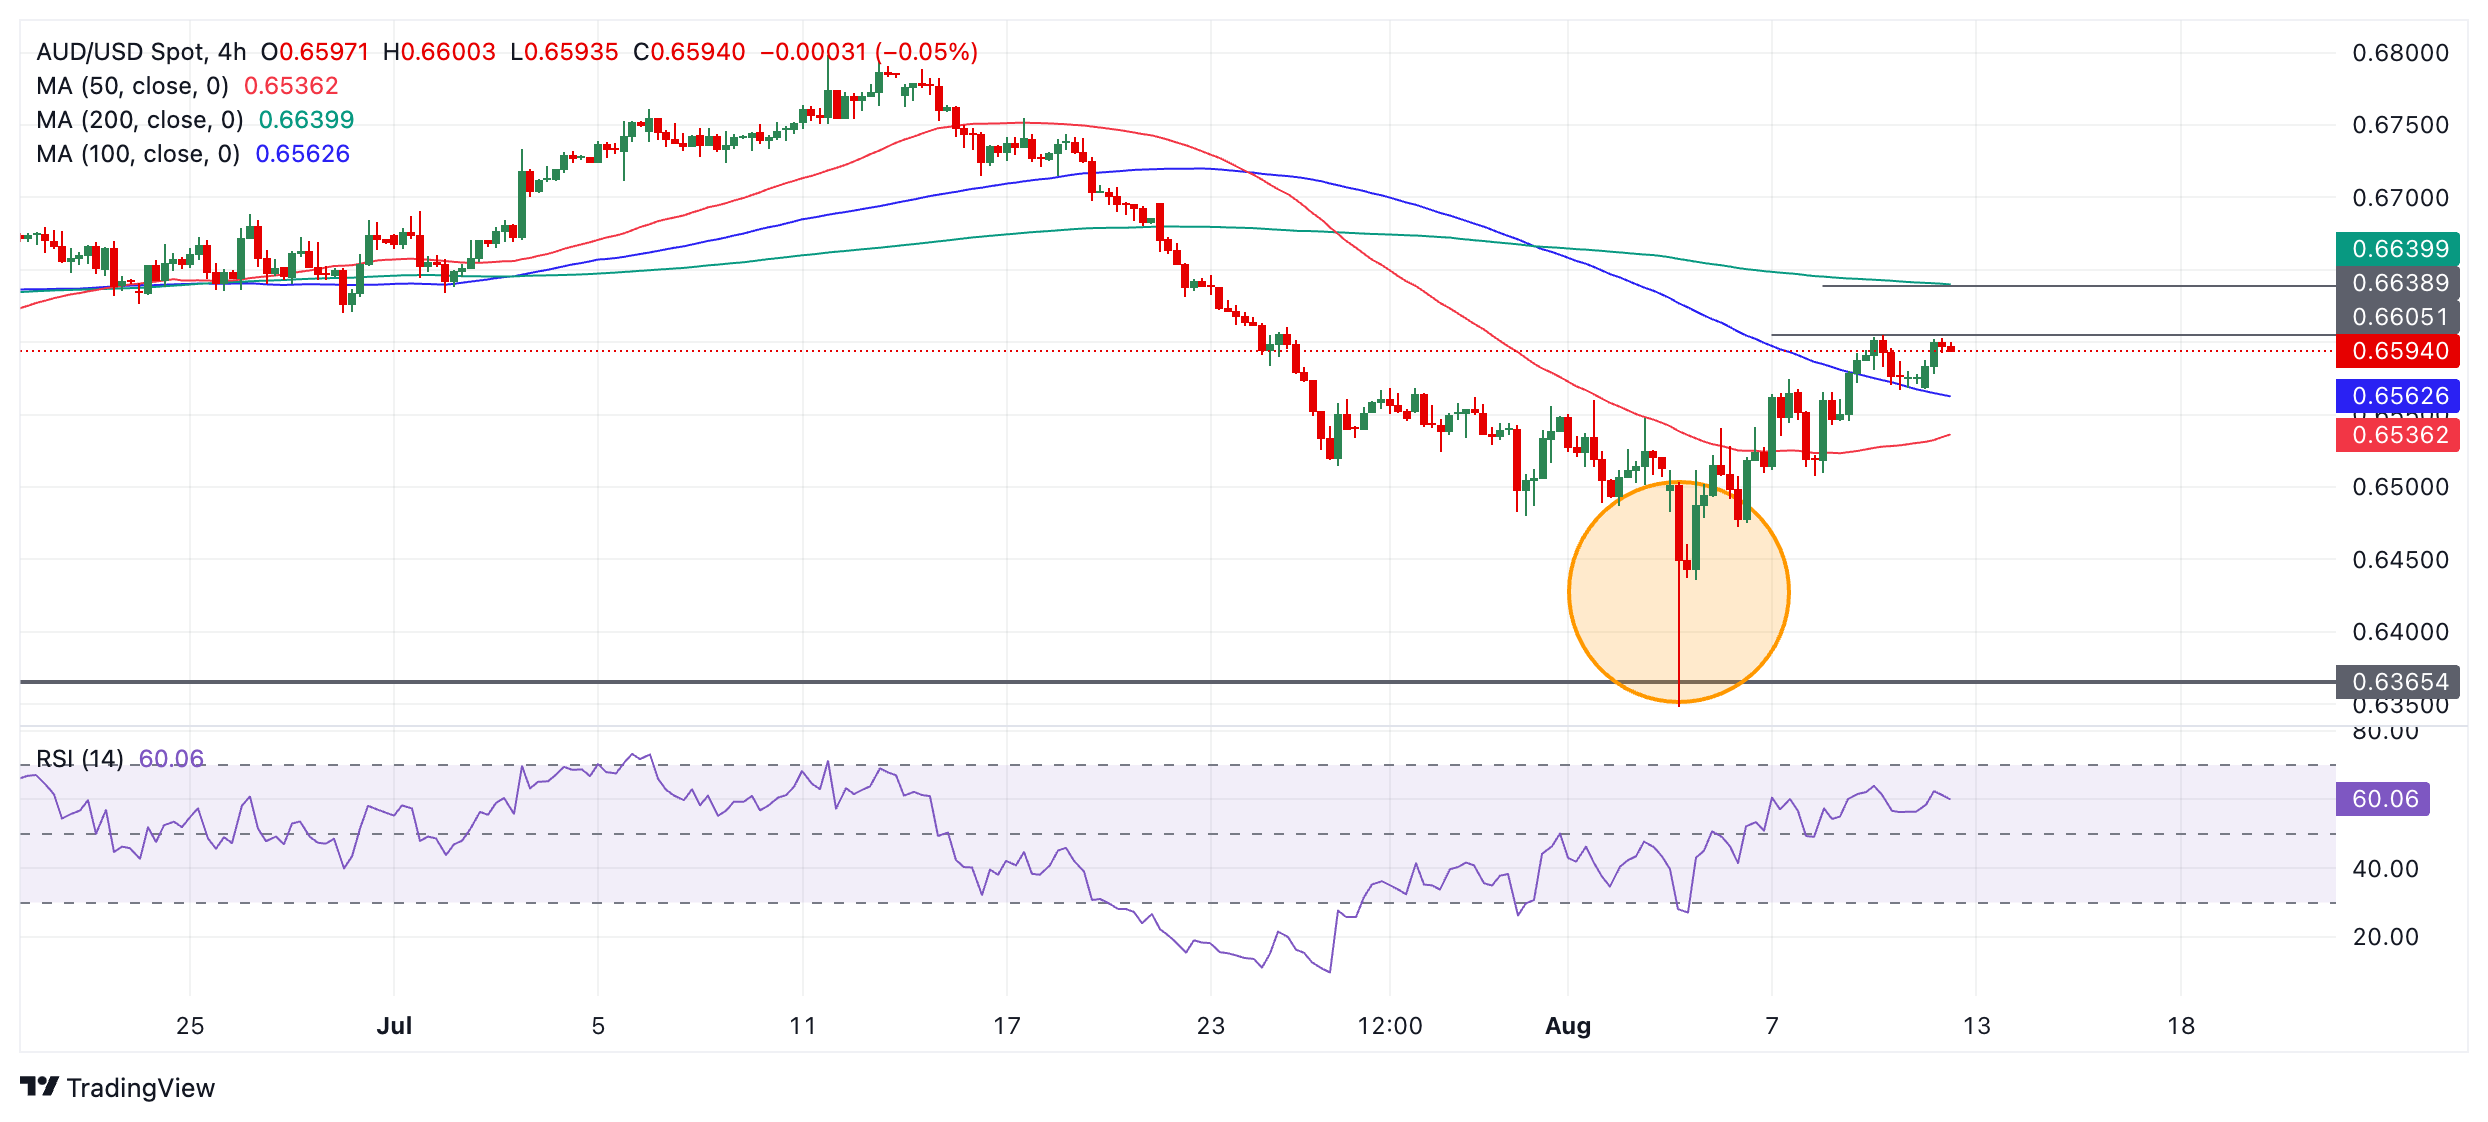
AUD/USD 4-hour Chart
Since then the pair has begun a new sequence of rising peaks and troughs on the 4-hour chart which denotes the formation of a new short-term uptrend. Given “the trend is your friend” this uptrend is biased to extend even higher.
A break above 0.6605 (August 9 high), would provide confirmation of a continuation higher, to a target at around 0.6639, at the level of the 200-period Simple Moving Average (SMA) and 50-day SMA. These major SMAs are expected to limit further gains, at least temporarily.
AUD/USD has broken above the 50 and 100-SMAs, indicating strong bullish momentum and the Relative Strength Index (RSI) is not yet overbought, suggesting further room for more upside.
Recommended Articles


Comments (0)
Click the $ button, enter the symbol, and select to link a stock, ETF, or other ticker.