


Samsung Stock Price Forecast: Shares Plunge Over 10% for Two Consecutive Days, Short-Term Correction of Nearly 20% May Lie Ahead



AI Podcast


As of the Asian trading session on July 8, Samsung shares closed down 6.25% at 277,500 KRW, marking a 14% two-day decline despite Q2 operating profits surging 19-fold year-over-year to 89.4 trillion KRW. This "sell-the-news" reaction follows a 100% rally over three months, where investors had already priced in AI and memory demand. Technically, the stock breached the 300,000 KRW support level and its 60-day moving average. With short-term sentiment turning bearish, the price faces further correction risks, potentially targeting the 232,500–266,000 KRW gap, or lower levels toward 210,000 KRW if selling pressure persists.

TradingKey - As of the Asian trading session on July 8, Samsung's stock price once plummeted by over 7% intraday from an initial 1% gain, hitting a low of 273,500 KRW, and closed down 6.25% at 277,500 KRW. Although Samsung released a Q2 earnings preview yesterday that far exceeded the same period last year, the stock price did not sustain the positive earnings momentum. Instead, it slumped for two consecutive trading days, with a cumulative decline of nearly 14%.
According to the earnings preview released by Samsung, the company's performance in the second quarter remained robust. Samsung expects consolidated sales for the second quarter to be approximately 171 trillion KRW, with an operating profit of about 89.4 trillion KRW. Compared to an operating profit of just 4.7 trillion KRW in the same period last year, this figure represents a nearly 19-fold increase and is also higher than the market's previous expectation of about 87.3 trillion KRW. The data shows that AI server demand, rising DRAM prices, a recovery in NAND, and procurement by data center clients continue to drive the rapid expansion of Samsung's profits.
From a technical perspective, Samsung's stock price achieved a cumulative maximum gain of over 100% over the past three months. This indicates that investors had already bet in advance on rising memory prices and the realization of AI orders, thereby pricing in future gains ahead of time. Once the company delivered its record-breaking earnings preview, the positive news became a sell-the-news event, prompting capital to opt for profit-taking, which in turn dragged down the stock price.
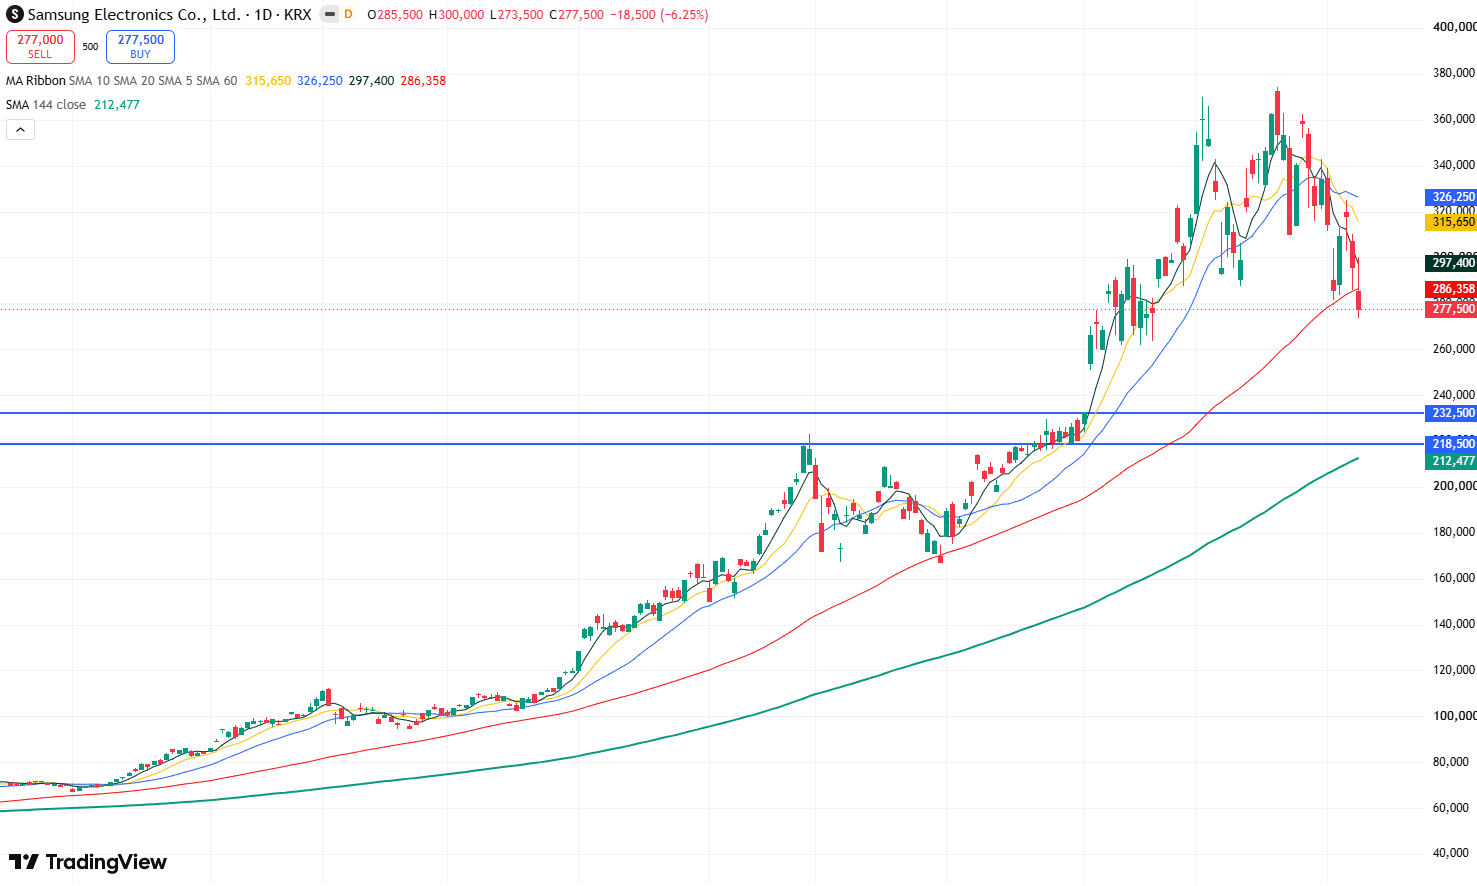
Samsung Electronics Stock Price Daily Chart, Source: TradingView
Looking at the daily chart of Samsung's stock price, the stock was confirmed to have broken below the 300,000 KRW mark yesterday, indicating that the previous strong rebound has encountered significant selling pressure. The 300,000 KRW level has now turned from support into resistance. If the stock price cannot reclaim this level, the short-term rebound potential will be limited. Meanwhile, the stock price was confirmed today to have broken below the 60-day moving average, implying that short-term market sentiment leans bearish and the stock price may enter a deeper correction phase.
At present, the primary target for the downward correction may be to fill the previous gap down to 232,500–266,000 KRW. If the stock price further breaks below 232,500 KRW, it may continue to pull back toward the 218,500–210,000 KRW range, which represents a decline of nearly 20% from the current price of 277,500 KRW.
This content was translated using AI and reviewed for clarity. It is for informational purposes only.
Recommended Articles









Comments (0)
Click the $ button, enter the symbol, and select to link a stock, ETF, or other ticker.