


Copper Price Forecast: Tight Supply Pushes Price Above $14,000, Can Copper Reach $15,000?



AI Podcast


International spot copper prices fluctuate near historical highs around $14,070, driven by tightening global supply and widening structural deficits projected for 2026. While short-term profit-taking and high prices dampen downstream demand, robust capital support remains evident. Demand is increasingly propelled by emerging sectors like AI data centers, power grids, and renewable energy, alongside cooling U.S. inflation and declining interest rate expectations. Technically, prices maintain a strong upward trajectory above the $14,000 support level, with primary resistance targeted at $14,521 and potential upside toward the $15,000 mark.

TradingKey - As of the European session on August 14, international spot copper prices (COPPER) continued to fluctuate near historical highs, trading around $14,070, down slightly by 0.3% intraday. Despite short-term profit-taking, international copper prices have maintained overall strength this year and once again stood above $14,000.
From a price action perspective, copper prices did not experience a deep pullback after breaking above $14,000, indicating strong capital support at high levels. However, following the rapid price rally, downstream acceptance of high prices has begun to decline, and the short-term market has entered a tug-of-war stage between tight supply and high prices dampening demand.
Copper Market's Long-Term Deficit Continues to Widen as Tight Supply Meets AI Demand
From a fundamental perspective, the core factor supporting the continuous rise in copper prices recently remains tightening global copper supply.
LME copper inventories have continued to decline recently, and supply tightness in the international spot copper market has further intensified. A recent Reuters analysis pointed out that LME inventories are rapidly diminishing, while the cash-to-three-month copper premium has widened, reflecting market participants' willingness to pay higher prices for immediate delivery of copper.
In recent years, major global copper mines have been continuously affected by declining ore grades, excessively long approval cycles for new projects, insufficient capital expenditures, and production disruptions in certain mining regions, while bringing new copper mines from discovery to formal production typically takes many years. Therefore, even if rising copper prices incentivize mining companies to increase investment, rapidly boosting supply in the short term remains difficult.
According to a Reuters survey, the global refined copper market could face a supply deficit of approximately 150,000 metric tons in 2026. As inventories have dropped further recently, market bets on supply tightness have heated up significantly.
Meanwhile, the demand side continues to grow. Beyond traditional real estate, automotive, and manufacturing sectors, AI data centers, power grid upgrades, electric vehicles, and renewable energy are becoming major sources of global copper demand growth. Data centers require not only vast amounts of cabling, but their underlying power transmission and distribution, grid expansion, and power generation facilities also require copper, ultimately transmitting AI capital expenditures into industrial metal demand.
In addition, the macroeconomic environment is also supporting copper prices. The latest U.S. CPI data showed inflation continuing to cool, leading the market to further reduce bets on a Federal Reserve rate hike in September. Lower interest rate expectations are generally favorable for industrial metals: on one hand, they may weigh on the U.S. dollar, lowering the cost of buying copper in non-dollar regions; on the other hand, lower interest rate expectations also improve global manufacturing and investment demand. The latest market pricing shows that the probability of a Fed rate hike in September has fallen to 32.4%.
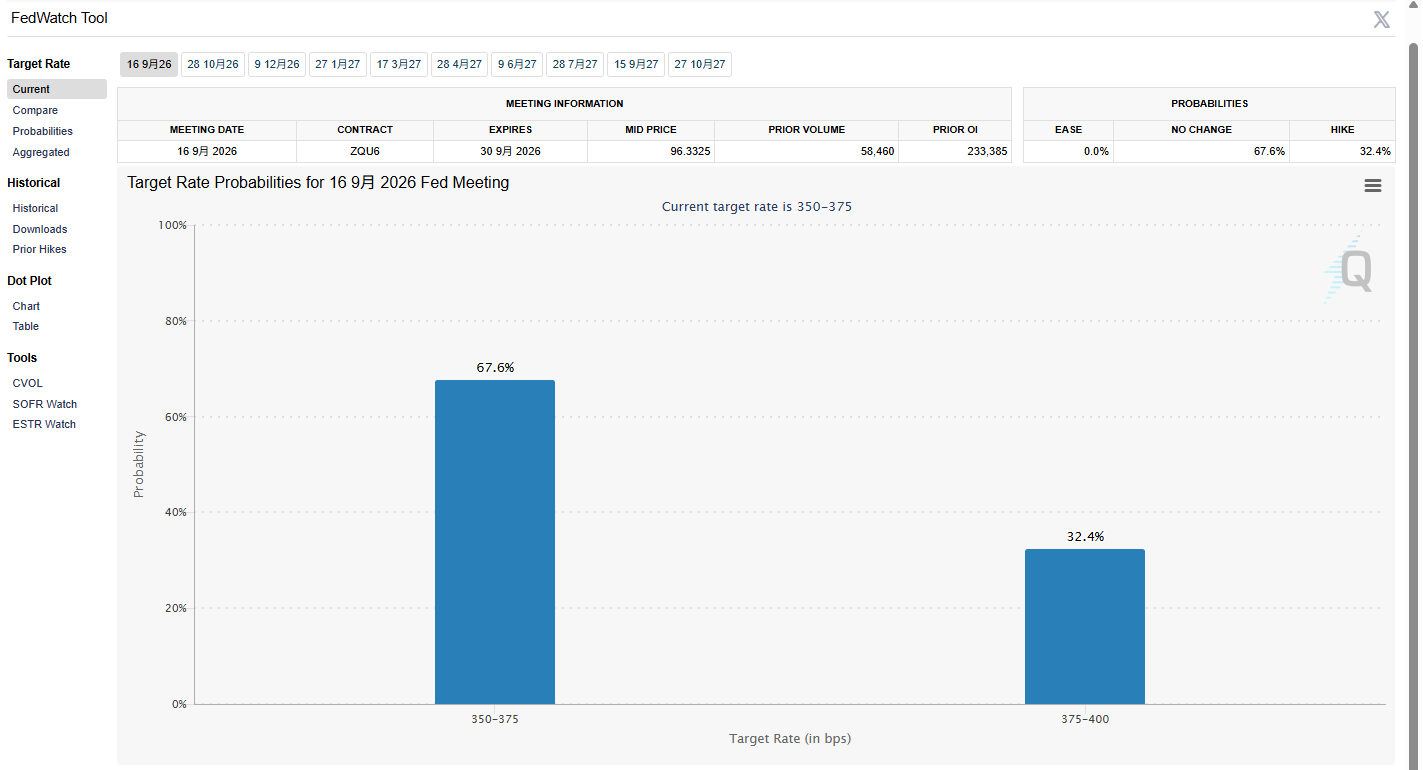
Source: CME Group
Copper Price Technical Analysis
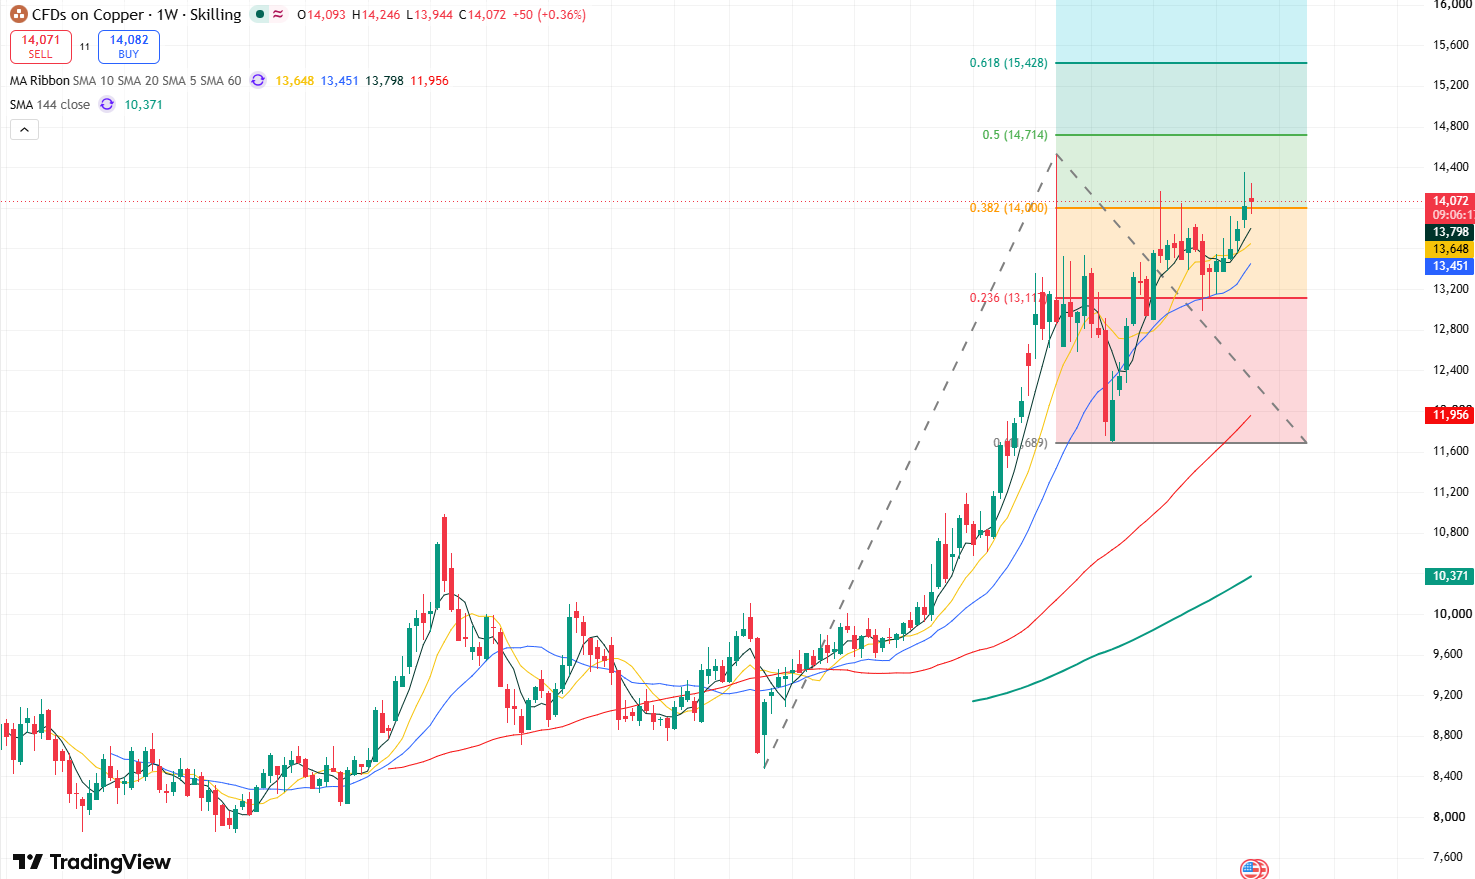
Weekly copper price chart, Source: TradingView
From the weekly chart of copper prices, the overall trend shows a clear upward trajectory, and as the price broke through the $14,000 mark, market bullish momentum was further enhanced.
Currently, copper prices have broken through and stabilized above the $14,000 level. To the upside, the primary resistance level to watch is the previous historical high of $14,521. If copper prices break this level to hit a new record high, they are expected to test the $15,000 mark upward. Further above, attention should be paid to the resistance level at the 0.618 Fibonacci extension of $15,400.
On the downside, the key primary support level for copper prices to watch is $14,000. If this level fails to hold, copper prices may pull back toward $13,900. If that level is breached, copper prices may further retreat toward the support level of $13,500.
This content was translated using AI and reviewed for clarity. It is for informational purposes only.
Recommended Articles












Comments (0)
Click the $ button, enter the symbol, and select to link a stock, ETF, or other ticker.