


Gold Has No P/E Ratio. So How Do You Tell If It Is Expensive?



AI Podcast


Despite falling 26% from January’s peak, gold remains historically expensive when measured against the “golden constant,” which adjusts the nominal price by US inflation to track long-term purchasing power. While the yardstick accurately signals long-term mean reversion over decades, it historically failed due to massive structural demand from central banks. Because gold lacks intrinsic cash flows, its current high valuation implies modest future real returns unless inflation or central bank buying accelerates. Consequently, investors should view gold as portfolio insurance rather than a wealth-compounding asset, using valuation metrics to cap position sizes rather than time short-term market movements.
Gold is down a quarter. Is it cheap now?
In January, gold surged to a record high of $5,608 an ounce. Nine months later it is back around $4,160, roughly 26% below the peak.
To many gold investors, that price looks tempting. The mental math is simple: the same ounce of gold now costs nearly $1,500 less than it did at the start of the year, so isn’t this a bargain? The problem is that “cheap” is always a comparison. Measured against January, gold is indeed cheaper. But what if you change the yardstick?
Stock buyers look at price-to-earnings ratios; home buyers look at price-to-rent ratios. These metrics all answer the same question: is the price I am paying high or low relative to what the asset is intrinsically worth? The trouble with gold is that it pays no dividends, no interest and no rent, so it seems to have no intrinsic value to compare against. As a result, most people can only compare today’s price with yesterday’s, and let price changes stand in for valuation.
In fact, gold does have a yardstick for valuation. It comes from a series of studies by Duke University finance professor Campbell Harvey and asset manager Claude Erb, and it is called the “golden constant.” Measure today’s gold with it and you get a result that surprises many people: even after falling by a quarter, gold is still more expensive in purchasing-power terms than it was at the famous bubble peak of 1980.
This article explains how the yardstick is built, how well it has measured in the past, why it sometimes fails, and how we, as gold investors, can use it.
The yardstick: the real gold price and the “golden constant”
To value gold, we first need to be clear about what gold is actually protecting.
The oldest reason people hold gold is that it guards against inflation: paper money loses value, gold does not. If that is true, then over the long run the gold price should rise roughly in line with consumer prices, and an ounce of gold should buy about the same basket of goods across decades and even centuries.
Erb and Harvey give a striking example in their research. They compared the pay of a Roman legionary with that of a modern US soldier and found that, converted into gold, the two are not far apart. In other words, over a span of two thousand years, gold has broadly preserved its purchasing power. That sounds like praise for gold, but it carries another implication: if gold merely preserves purchasing power, its long-run real return is close to zero. Gold is a store of value, not a wealth-compounding machine.
Following this logic, you can build the yardstick. Divide the nominal gold price by the US Consumer Price Index (CPI), and you get the “real gold price,” the price of gold with inflation stripped out. If gold only preserves value over the long run without growing it, the real gold price should fluctuate around a long-term average. That average is what Erb and Harvey call the “golden constant.”
Using US CPI (1982–84 average = 100) as the base, they estimate that the average real gold price since 1975 is about 3.46. On its own, the number has no intuitive meaning. It works much like a P/E ratio: you have to place it in its historical range to know whether today is expensive or cheap. Harvey himself draws exactly that analogy to the P/E ratio.
The calculation is simple enough for anyone to do: take the US dollar gold price and divide it by the latest US CPI reading. With September’s CPI of 336.3 and a recent gold price of about $4,160, today’s real gold price is about 12.4, or 3.6 times the historical average. We use the dollar gold price and US CPI because gold is priced internationally mainly in dollars, and the underlying research is built on US data. But the multiple alone is not enough. To judge what this reading means, we need to look at what happened after the real gold price reached extreme levels in the past.
Has the yardstick measured accurately in the past?
Look back at the moments when the real gold price was most extreme, and a clear pattern emerges: the more expensive the starting point, the worse the real return over the following decade; the cheaper the starting point, the better the return.
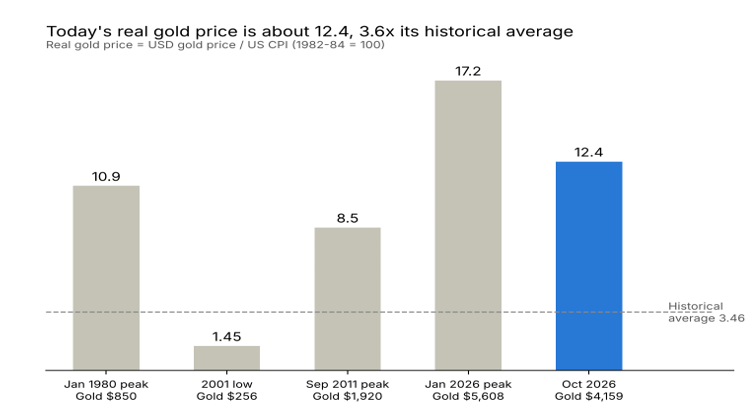
In January 1980, gold spiked to $850 an ounce and the real gold price set what was then an all-time record. It was an era terrified of inflation: after two oil crises, US inflation topped 13% at one point and people queued to buy gold. Then Fed Chairman Paul Volcker pushed interest rates toward 20%, inflation was crushed, and gold lost its reason to rise. Over the next decade gold drifted steadily lower and its nominal price halved, while US consumer prices rose more than 60%. Put together, holders lost roughly 70% of their real purchasing power.
2001 was the opposite extreme. After two decades of bear market, gold had been abandoned by almost everyone: internet stocks were hot, and central banks such as the Bank of England were still selling off their gold reserves. Gold bottomed around $256, and the real gold price was less than half its historical average. The moment nobody wanted gold was exactly the moment the yardstick showed it was cheapest. The following decade was gold’s most glorious bull market: after inflation, purchasing power more than quadrupled.
In September 2011, gold climbed to around $1,920 and the real gold price was once again far above average. The financial crisis had just ended, the Fed was rolling out round after round of quantitative easing, markets widely feared the dollar would be diluted by money printing, and “gold above $2,000” was a hot talking point. But as the economy recovered and expectations of an end to easing grew, gold entered a bear market that lasted several years. Ten years later, gold still had not returned to its 2011 high, and after inflation it showed a real loss of about a quarter.
Starting point | Gold price 10 years later | US price-level change | 10-year real return |
Jan 1980 peak | ≈ $410 (Jan 1990) | ≈ +64% | ≈ -70% |
2001 low | ≈ $1,480 (Apr 2011) | ≈ +27% | ≈ +350% |
Sep 2011 peak | ≈ $1,760 (Sep 2021) | ≈ +21% | ≈ -24% |
Erb and Harvey tested this more systematically and reached the same conclusion: when the real gold price is above average, subsequent real returns tend to be below average. This is mean reversion. They also caution that the pattern is almost useless in the short run. Over one or two years, momentum dominates the gold price: what is rising keeps rising and what is falling keeps falling. Only over a horizon of about ten years does the pull of reversion show up. And we should be honest about one more thing: counting from 1975, there are only about five non-overlapping ten-year periods. The sample is small and the statistics are not robust. So this yardstick is more of a directional hint than a precise law.
If it does work, then, what force is pulling the real gold price back?
Why reversion happens: high prices create their own sellers
What pulls the real gold price back is the most basic force of supply and demand: when prices are too high, more people want to sell and fewer want to buy.
Start with supply. The higher the gold price, the fatter miners’ margins, the stronger their incentive to expand output, and marginal mines that were previously uneconomic come back online. Metals Focus expects global mine production to grow 2.4% in 2026 to a record 3,907 tonnes.
Recycling responds faster than mines. A new mine takes years to build, but jewellery and bars at home can be sold at any time. Global recycling reached 1,404 tonnes in 2025, a 13-year high. After gold retreated from its peak this year, Indian households sold nearly 50 tonnes of old gold in the second quarter alone, up 43% from a year earlier. The mechanics of gold recycling are actually quite complex, and sometimes higher prices make people more reluctant to sell. We will cover that topic separately in a future article.
Now look at demand. Jewellery is one of the largest sources of physical gold demand in the world, and it is highly price-sensitive. In 2025, as gold soared, jewellery fabrication came under heavy pressure, with India and China seeing the largest declines and many consumers switching to bars and coins.
Investment demand, by contrast, often moves the other way. Rising prices attract momentum money; gold ETF inflows are strongly positively correlated with gold’s price moves, so the more gold rises, the more people buy. This kind of buying amplifies the real gold price’s deviation from its average in the short run, which is why the real gold price can stay elevated for years instead of turning around as soon as it hits a high.
There is one number, however, that guarantees this reversion will be slow. Of all the gold humans have ever mined, about 210,000 tonnes are still above ground, and annual new mine supply is less than 2% of that stock. Changes in supply are like adding water to a huge reservoir: it takes a long time before the water level visibly moves. This also explains why the pattern in the previous section plays out over decades rather than months.
More importantly, this reversion mechanism rests on an implicit assumption: that buyer behaviour stays broadly the same, so that when prices are high, fewer people buy. Once a new class of buyer appears that is insensitive to price and large enough in scale, the force of reversion can be held down. This is precisely why the yardstick failed over the past decade.
The decade the yardstick failed
Apply the golden constant mechanically to today and you get a startling answer: 3.46 multiplied by September’s CPI of 336.3 gives a so-called “constant gold price” of only about $1,160, less than 30% of the current price.
Erb and Harvey made this kind of projection themselves, and it cost them. In 2013, based on what was then an elevated real gold price, they estimated that gold’s real return over the next decade could be around minus 10% a year. In 2015, Harvey went further: if the real gold price returned to the constant, gold would be worth about $825; if it overshot, it could even fall to $350.
At first, the market was on their side. Gold slid from around $1,400 in mid-2013 to about $1,050 by the end of 2015. But then the script changed completely: from there, gold rose to $5,600 over the next decade. Far from returning to 3.46, the real gold price surged to 17.2 this January, well above the record set in 1980.
From an investor’s point of view, this episode is especially instructive. Anyone who sold all their gold in 2013 on the basis of this projection would have felt vindicated for the first two years, as gold fell by a quarter. But if they had waited for gold to return to $825 before buying back, they would have missed the entire subsequent rally of more than fivefold. The yardstick showed that gold was expensive, but it could not say how long it would stay expensive, still less whether the structure of the market would change. It also shows that judging value and judging timing are two completely different skills. Valuation tells you how much risk you are taking; timing depends on when money changes direction. Confuse the two, and it is easy to lose money on a correct judgment.
The problem lies in the assumption from the previous section. Over the past few years, the gold market has welcomed a group of very large new buyers: since 2022, central banks around the world have bought an average of about 1,000 tonnes of gold a year, equivalent to a quarter of annual mine output. Central banks do not buy gold because it is cheap; they buy it to diversify their foreign reserves and reduce their reliance on dollar assets. Buyers like these are insensitive to price and keep buying even when gold is expensive, and the reversion force of “high prices bring out sellers and turn away buyers” has been absorbed by their purchases again and again.
This year’s market confirms the point from the other direction. According to revised World Gold Council data, central banks bought only 57 tonnes of gold in the first quarter of this year, the weakest first quarter in more than a decade. As soon as the new buyers slowed down, the yardstick’s pull reappeared: combined with the Fed’s shift from rate cuts to rate hikes, gold fell a quarter from its January peak and the real gold price dropped from 17.2 back to around 12.4. This does not prove that reversion has begun, but it reminds us how much today’s high reading depends on those new buyers continuing to buy.
Interestingly, Erb and Harvey actually anticipated this possibility in their 2013 paper. They wrote that if emerging-market countries wanted to raise their gold holdings to the per-capita levels of developed countries, they would have to buy large amounts of gold from existing holders, and to persuade those holders to sell, they would have to offer a high enough price. The real gold price could therefore end up far above the level of the time. They called this the “golden dilemma”: on one side, the pull of the historical average; on the other, structural new demand. No one can know in advance which force will win.
The lesson from this episode is that the golden constant is not a price target for gold, let alone a “fair value.” It is a measuring stick that tells you where you stand in history today, and what kind of story you need to believe in order to justify today’s price.
How traders can use the yardstick
If the yardstick can fail, is it still useful? Yes, but only if used in the right place. Here are four ways to use it.
First, separate the time horizons. The real gold price has almost no predictive power over moves within one or two years; in the short run, gold is driven by fund flows and sentiment. If you use the golden constant to guess whether gold will rise or fall next month, you will be disappointed. Where it is genuinely useful is in setting long-term expectations over five to ten years.
Second, use it to work out long-term returns, not to time the market. Plug today’s reading into a few scenarios and you can see what the next decade’s returns look like under different assumptions. Assuming US inflation averages 3% a year over the next ten years, CPI would rise to about 452 by 2036, with the following results:
Real gold price in 10 years | Implied gold price (USD/oz) | Annualised return from today |
Falls to 8 (near the 2011 peak) | ≈ 3,600 | ≈ -1.4% |
Stays at 12.4 (today’s level) | ≈ 5,600 | ≈ +3.0% |
Returns to 17.2 (Jan 2026 peak) | ≈ 7,800 | ≈ +6.5% |
The message of this table is straightforward. If the real gold price merely stays at today’s high level, gold’s long-term return will simply keep pace with inflation. To earn returns clearly above inflation, the real gold price has to keep climbing, which means new buyers such as central banks have to keep adding. And if the real gold price falls back part of the way toward its historical average, even just to the level of the 2011 peak, gold could be cheaper in ten years than it is today. Before you buy, you should be clear about which scenario you are betting on.
Third, use it to set a ceiling on position size. When the real gold price is at historical lows, as in 2001, gold has limited downside and large upside, and you can allocate more aggressively. When the real gold price is high, gold can still serve as insurance in a portfolio, but it is not suited to a concentrated bet, much less to leverage. Today’s reading is 3.6 times the historical average, which puts us in the second case.
For example, suppose you planned to allocate 10% of your assets to gold. In years when the real gold price is only around 2, you might raise that to 15%; at today’s high reading, you might keep it at 10% or even trim it slightly, treating gold as ballast for the portfolio rather than its main source of returns. The right percentage differs from person to person; the key is to adjust your position in the opposite direction to the yardstick’s reading: the more expensive gold is, the more restrained you should be.
Fourth, take regular measurements and watch the trend, not a single point. Every quarter, divide the gold price by the latest CPI and record the result. If gold moves sideways while consumer prices keep rising, the real gold price will slowly fall, meaning the “expensiveness” on the yardstick is being digested by time rather than necessarily by a falling gold price. Here is a worked example. In September, gold was $4,160 and CPI was 336.3, a reading of 12.4. If a year from now gold is unchanged while CPI rises 3% to about 346, the reading falls to 12.0: gold becomes a little cheaper without its price falling a cent. Conversely, if gold rises 10% in a year while prices rise only 3%, the reading rises to 13.2, meaning gold has become more expensive.
Insurance is never cheap
Back to the question we started with: now that gold has fallen by a quarter, is it cheap?
Compared with January, yes. Measured against the purchasing power gold has preserved over two thousand years, gold today is still very expensive, more expensive than in 1980 and more expensive than in 2011. These two conclusions do not contradict each other; they answer questions on different time scales.
This body of research leads to a somewhat uncomfortable conclusion: gold tends to have its lowest expected returns precisely when it is most popular. That may sound like advice to stay away from gold, but it is not. Gold’s role in a portfolio is insurance, and insurance is always most expensive when people are most worried. Paying a high price today buys protection against debt, inflation and geopolitical conflict. That protection has value; we just should not expect it to deliver high returns at the same time.
Look at it another way: an expensive premium does not mean you should not buy insurance. The chance of your house catching fire does not fall because the premium has risen. What you really need to weigh is how much risk you face and how much potential return you are willing to give up for that protection. For an investor worried about currency debasement and geopolitical conflict, keeping some gold makes sense even at high prices. For someone who simply wants to make quick money from gold, today’s reading is a loud warning.
So the more important question is not “can I buy now?” but how much premium you are willing to pay for this insurance, and what share of your assets you are prepared to put into it. The yardstick will not make the decision for you, but it will make sure that when you decide, you know exactly where you stand in history.
Recommended Articles







Comments (0)
Click the $ button, enter the symbol, and select to link a stock, ETF, or other ticker.