


Gold Has Its Own Interest Rate? A Hidden Mechanism Thirty Years in the Making — and Quietly Falling Apart



AI Podcast


For three decades, gold prices were artificially suppressed by a "leasing" mechanism where central banks lent gold to bullion banks, which then sold it into the spot market. Combined with miner hedging, this created a massive, persistent supply overhang. Today, this chain is collapsing: central banks have shifted from lenders to net buyers, miners have largely abandoned hedging, and regulatory changes like Basel III have increased costs for market-makers. As this artificial supply dissipates, gold is transitioning toward a price discovery model driven by genuine physical scarcity, potentially shifting the long-term equilibrium toward higher valuations.
Most people hold a deep-seated image of gold: it sits silently in a vault, earning no interest, paying no dividends, doing nothing but waiting for its price to rise or fall.
That image is only half right.
Gold has its own interest rate system, its own lending market, its own supply-and-demand logic — it's just that this system is buried so deep that ordinary investors almost never encounter it. And for the past thirty years, it is precisely this system that has suppressed gold prices in an extraordinarily hidden way. Today, that same system is quietly, steadily coming apart.
To understand what's happening, we first need to answer one question: how does gold get "leased out"?
The Central Bank's Dilemma: Gold Gathering Dust, Costing Money Every Year
The story starts from an angle you may never have considered: central banks are the largest official holders of gold in the world, collectively holding roughly one-fifth of all the gold ever mined in human history. Yet holding gold is, in purely financial terms, a losing proposition.
Gold pays no interest like a government bond. It pays no dividends like a stock. Lock it in a vault and you still owe annual fees for security, insurance, and storage. From a pure balance-sheet perspective, gold is a silent rock — every year you hold it, it quietly drains your budget.
So a clever idea emerged among bankers: lease the gold out.
Central banks could lend their gold to commercial banks — primarily the large international financial institutions active in the London Bullion Market Association (LBMA), known as bullion banks — and charge a fee called the Gold Lease Rate (GLR). In calm markets this rate is typically very low, around 0.1% to 0.5%, spiking only briefly during rare periods of stress. That doesn't sound like much, but for an asset that normally earns nothing at all, even a fraction of a percent in annualized return is pure gain.
A word on the mechanics: in practice, gold leasing works less like a rental and more like a collateralized cash loan — the central bank hands over gold, receives cash, and invests that cash to earn a return. The Gold Lease Rate is the net spread in between. This detail will matter later.
Crucially, from the central bank's perspective, the gold has not been "sold" — the books still show the same tonnage, merely on temporary loan. This allows the central bank to generate a trickle of cash flow from a silent rock without formally disposing of a strategic asset.
The logic sounds reasonable. Even harmless.
But what happens after the gold leaves the central bank's vault is where things get truly interesting.
After Borrowing the Gold — What Did Commercial Banks Do With It?
Commercial banks that borrowed gold from central banks had no intention of locking it in their own vaults. They wanted it to work.
The most common playbook: sell the borrowed gold immediately in the spot market for dollars, then deploy those dollars into higher-yielding assets — US Treasuries, for instance, or various carry trades. When the lease expires, use the investment proceeds to buy back an equivalent amount of gold on the open market and return it to the central bank.
This is the Gold Carry Trade: borrow gold at a low lease rate, convert it to dollars, earn a higher dollar return, and pocket the spread.
The logic is identical to a classic currency carry trade — borrow cheap, lend dear, collect the difference. The only distinction is that the "cheap funding currency" isn't the yen or the Swiss franc. It's gold.
Here is where a critical problem emerges.
All that gold sold into the spot market added to the supply of gold available in the market.
Annual gold mine production in recent years runs around 3,600 to 3,700 tonnes. At its peak — the late 1990s through the early 2000s — the gold leased out by central banks and the hedge books of mining companies together represented thousands of tonnes of latent supply overhang. This was not a single year's worth of new supply; it was an accumulated stock of positions that sat permanently above the market, pressing down on prices.
More supply means more price pressure.
It is worth addressing an intuitive question: if this gold eventually has to be returned, doesn't that create future demand that offsets the supply? The answer is no — because neither the mining companies nor the bullion banks return gold through the spot market. Miners deliver their physical production directly to the bank; bullion banks settle via forward contracts locked in at previously agreed prices. Both routes bypass the spot market entirely. The selling pressure hits spot prices; the repayment does not. The mechanism is asymmetric and one-directional.
Many analysts regard this as one of the key reasons gold prices languished throughout the 1990s into the early 2000s — though gold prices are shaped by many factors, including the willingness of large holders to sell or hold.
Miners Enter the Picture: Selling Tomorrow's Gold Today
Central banks were the "backers" of this system. Commercial banks were its operating machinery. But there was a third critical actor in the chain: gold mining companies.
Miners face a natural dilemma. They dig gold out of the ground, but they have no idea what gold will be worth today, let alone three years from now. Uncertain prices mean uncertain revenues; uncertain revenues make it harder to borrow money to build a mine.
So commercial banks designed a product for them: Gold Forward Sales.
The mechanics: a mining company borrows gold from the bank, immediately sells it on the spot market for cash, and uses that cash to fund mine construction and operations. When the mine is built and the gold is flowing years later, the company repays the loan with freshly mined metal.
For miners, this solved two problems at once: it provided upfront capital, and it locked in a sale price (whatever spot was when the borrowed gold was sold), eliminating the fear of a price collapse before the mine was producing.
From a market-wide perspective, however, the effect was to sell into today's spot market gold that wouldn't exist for years.
Future supply was pulled forward into the present.
This pushed spot prices lower still. And lower spot prices convinced more mining companies that prices might fall further — making it more attractive to lock in today's price — driving yet more hedging, in a self-reinforcing loop.
How extreme did it get? By the late 1990s through 2001, the global producer hedge book had swelled to a peak of over 3,000 tonnes — roughly equivalent to an entire year of global mine production sold forward into the market. The most extreme example was Barrick Gold, then the world's largest gold miner: by the early 2000s, its hedge book had accumulated roughly 24 million ounces of short exposure, equivalent to approximately four years of its own production.
The Barrick Lesson: The Tool That Was Supposed to Protect Nearly Destroyed the Company
Through the 1990s, Barrick's hedging program was considered the industry gold standard. In a world of falling gold prices, locking in a fixed sale price kept profits stable, and banks were happy to extend credit to a well-hedged miner.
Then the world reversed.
After bottoming at roughly $252 per ounce in August 1999 — a twenty-year low — gold entered a multi-year bull market beginning around 2001 that pushed prices steadily higher. Barrick's contracts, which had locked in prices from a different era, became an ever-heavier burden.
Competitors were selling gold at $600, $800, $1,000 per ounce. Barrick was delivering into contracts struck at $300, $350, $400. Every ounce it mined came with a built-in penalty for having been too clever.
In September 2009, Barrick announced the elimination of all fixed-price hedge contracts and the unwinding of a portion of its floating contracts. The cost: a $5.6 billion after-tax charge in the quarter, funded in part by a roughly $3.5 billion equity offering that netted approximately $3.4 billion. By December, the fixed-price hedges were gone — though approximately $700 million in floating obligations remained.
$5.6 billion. In 2009 dollars.
For a mining company, that is an enormous number of years of profits handed over as a tax on cleverness.
Barrick's story has been cited in finance classrooms ever since as the canonical case study in how derivatives hedging can destroy rather than protect value.
But its significance in this story goes beyond a cautionary tale. It marks the end of an era.
1999: One Agreement That Started to Unravel the Mechanism
Barrick was not alone. As gold prices reversed in the 2000s, the entire industry began systematically dismantling its hedges. Miners came to understand that selling forward their own production was insurance when prices fell — and a trap when prices rose. The chart below captures this collective retreat clearly: from the frenzied accumulation of the 1990s, to the peak in 2001, to two decades of steady unwinding.
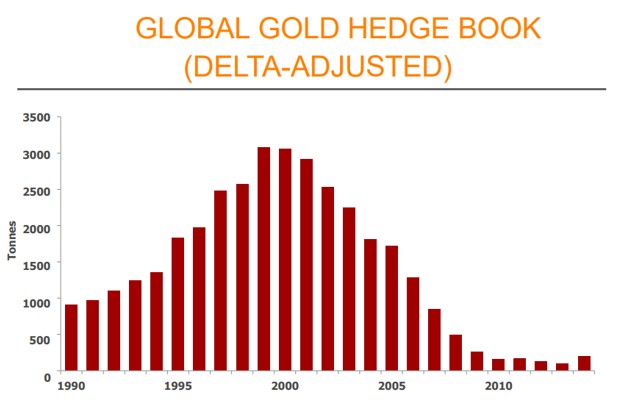
Source: Thomson Reuters
But before the miners abandoned their hedges, a more important event had already shifted the foundations of the entire system — back in 1999.
On September 26, 1999, on the sidelines of the IMF Annual Meetings in Washington DC, the European Central Bank (ECB) and fourteen European national central banks — fifteen signatories in total — jointly signed an agreement that came to be known as the Washington Agreement on Gold. Notably, the Federal Reserve never joined; the United States has always regarded the dollar, not gold, as the core of its reserve framework.
The agreement's key terms: signatories committed to limit collective gold sales to no more than 2,000 tonnes over the following five years, and pledged not to expand their gold lending or derivatives activities.
The backstory: throughout the late 1990s, multiple European central banks had been selling gold in an uncoordinated fashion — the UK had announced the auction of a large portion of its reserves — pushing gold to that $252 low in August 1999. The agreement was the central banks collectively acknowledging that their disorderly behavior was destroying the value of their own assets.
When the agreement was announced, gold surged sharply over the following days, rising roughly twenty percent within two weeks. It triggered two cascading effects: speculative funds rushed to cover short positions and went long, and producer hedging began a historic reversal — from sustained accumulation to systematic reduction. This was the starting gun for the wave of dehedging that eventually swept through Barrick and its peers.
In retrospect, the Washington Agreement stands as one of the most important turning points in thirty years of gold market history — marking the moment when central banks began transitioning from sellers flooding the market to stewards carefully managing their reserves.
That transition took twenty years to complete. In 2019, the signatories chose not to renew the agreement — because by then, no one needed it. No European central bank wanted to sell gold anymore. The market had completely reversed.
Once, central banks were sellers. Now, they are buyers.
This background is essential to understanding the structure of today's gold market.
The Gold Lease Rate: A Market Thermometer Nobody Ever Taught You
With all that background established, we can now properly explain the gold lease rate — and why it deserves more attention today than at any previous point.
Simply put, the gold lease rate is the cost of borrowing gold. It is determined by supply and demand: when many parties are willing to lend gold (central banks leasing, miners selling forward) and few want to borrow it, the rate stays low. When lenders are scarce and borrowers are urgent — say, a sudden need for large quantities of physical gold for delivery — the rate spikes.
This indicator has a fascinating property: it barely moves in calm markets, but when structural dislocations appear, it tends to signal them earlier than the gold price itself.
Around the time of the 1999 Washington Agreement, gold lease rates spiked sharply — briefly surpassing dollar interest rates, something that almost never happens under normal conditions. It reflected the sudden constraint on central bank gold lending and the resulting tightening of physical supply.
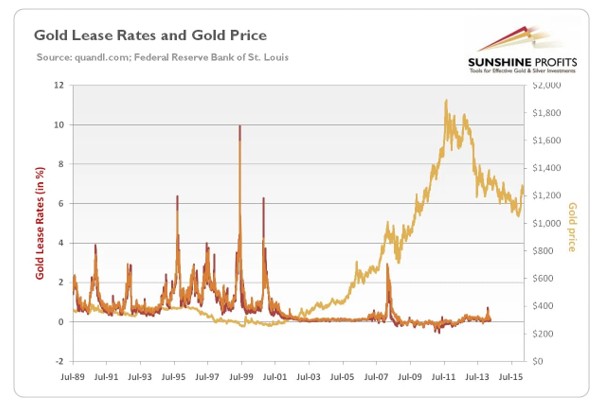
Source: Golden Meadow
A more recent — and more dramatic — episode unfolded in January and February 2025.
As the Trump administration signaled the possibility of tariffs on precious metals, buyers in the US market began aggressively moving physical gold from London to New York. COMEX inventories surged in a matter of weeks while LBMA inventories in London fell sharply.
The result: the pool of gold available to borrow in London shrank dramatically. The gold lease rate climbed from 0.08% on January 2nd to above 3%, briefly approaching 4.5% in early February. The last time rates reached anything like these levels was 2002.
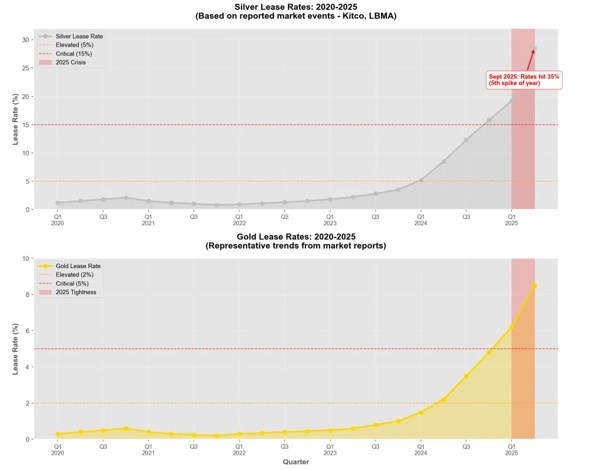
Source: Bullion Trading
From 0.08% to nearly 4.5% — this was not a fluctuation. It was an explosive signal: someone urgently needed physical gold and could not find it.
What made the episode even more striking was a rare market phenomenon that accompanied it: gold entered a state known as backwardation — spot prices trading above near-term futures, with short-dated forward rates turning negative. In plain terms, for a brief period, holding physical gold was more "yielding" than holding dollars.
That almost never happens in the gold market.
When it does, it means physical gold has become, however briefly, scarcer than dollars.
The thermometer read even more extreme numbers in the second half of 2025 — a story we will come to shortly.
From Leasing Gold to Hoarding It: The Historic Reversal of Central Bank Behavior
In the 1990s, central banks viewed gold as an obsolete, non-yielding burden — something to be leased if possible, sold if practical. The prevailing consensus among mainstream Western economists was almost axiomatic: gold's role in the modern monetary system would continue to diminish, eventually reverting to a purely industrial metal.
That consensus began cracking in the 2000s. By 2022, it had been demolished.
According to the World Gold Council's latest annual data, global central banks have been net buyers of gold for sixteen consecutive years. For three consecutive years — 2022 (approximately 1,082 tonnes, a historical record), 2023 (approximately 1,051 tonnes), and 2024 (approximately 1,045 tonnes) — net purchases exceeded 1,000 tonnes annually, more than double the average of approximately 473 tonnes per year between 2010 and 2021. In 2025, the pace eased to approximately 863 tonnes — still the sixteenth consecutive year of net buying, and still well above historical norms. The structural trend of central bank gold accumulation remains firmly intact.
2025 also brought a historic milestone. According to the ECB's June 2026 report, gold accounted for 27% of global official reserves by market value at end-2025, surpassing US Treasuries at 22% — the first time this has occurred since 1996, nearly thirty years ago.
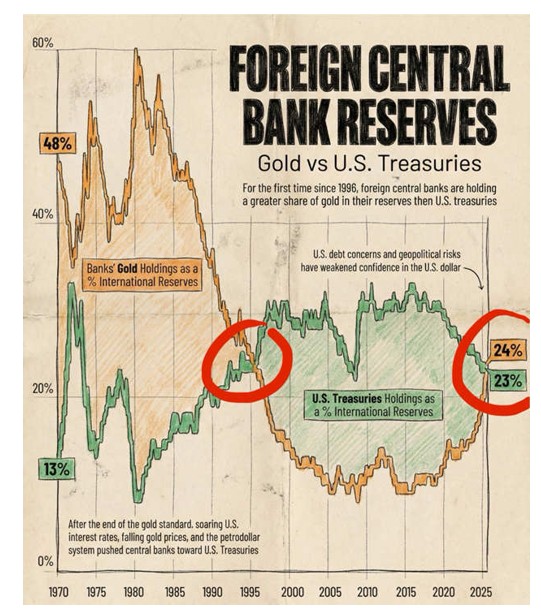
Source: Global Markets Investor
This is not a technical statistical coincidence. It reflects a genuine shift in reserve preferences — at least a portion of the world's central banks are signaling through their actions: in an age of uncertainty, gold feels safer to hold than US Treasuries.
This shift has a critically important structural consequence for the gold lending market: fewer and fewer central banks are willing to lease their gold out.
The reasoning is simple. If you believe gold will become more valuable over time, why would you lend it out for less than 1% per year — allowing someone else to sell it into the market? The economics of leasing grow less attractive the more bullish you are on the metal.
The result: the total stock of gold available to borrow in the leasing market is in systematic decline. This directly erodes the price-suppressing effect that leasing supply has exerted for thirty years.
The old chain — central banks lending gold, commercial banks selling it into the market, miners hedging their production — is breaking apart, link by link.
London Today: The Cracks in the Paper Market Are Widening
With the history of gold leasing in mind, the events unfolding in London's market in 2025 and 2026 look less like technical market noise and more like the symptoms of an aging system under increasing strain.
The London Bullion Market Association (LBMA) is the world's most important gold trading hub. Each day, gold worth tens of billions of dollars — equivalent to hundreds of tonnes — changes hands here through what are called "unallocated accounts." In other words, most gold trades involve no physical bar movement whatsoever; they are simply numerical entries shifting between bank ledgers. What a buyer receives is not a specific gold bar but a claim against a bank.
This system works seamlessly when liquidity is ample and physical demand is modest. But when an external shock — tariff risk, geopolitical crisis, fear of a physical shortage — triggers large-scale demands for actual delivery, its fragility is exposed.
In January and February 2025, COMEX gold inventories surged over a matter of weeks while London's LBMA saw a visible drawdown. The EFP — the spread between London spot and New York futures — widened to $40–50 per ounce. In normal conditions, that spread is just a dollar or two.
This spread told a simple story: shipping gold from London to New York had suddenly become difficult and expensive.
An even more extreme signal came from gold's sister metal — silver. On October 9, 2025, London silver's one-month lease rate spiked to approximately 35% — a historical record — while the overnight rate briefly exceeded 100% annualized. In a normal year, these rates sit around 0.3% to 0.5%.
This was no price fluctuation. It was something close to a scream from the market: there is not enough physical metal to be found.
Some traders resorted to chartering cargo aircraft to fly silver from New York to London just to meet delivery obligations.
These are scenes that simply did not exist in the precious metals markets of the past several decades.
What Does This Unraveling Mean for Investors Holding Gold?
All of the above brings us to the question investors actually care about: if the gold leasing mechanism is breaking down, what does that mean for the gold I'm holding?
To answer it properly, we need to return to the essence of the suppression mechanism.
For thirty years, the gold leasing system effectively manufactured a continuous source of additional supply: central banks leased their gold out, commercial banks sold it for dollars, mining companies pre-sold future production. Layered together, these behaviors kept the gold circulating in the market persistently above what true mine supply alone would suggest. Supply was artificially elevated; prices were artificially depressed.
Today, every link in that chain is reversing simultaneously:
- Central banks: from sellers to buyers, from lenders to holders.
- Mining companies: from large-scale hedgers to almost entirely unhedged — the industry-wide lesson of Barrick's catastrophe is deeply remembered.
- Commercial banks: under Basel III, holding gold positions requires significantly more stable funding, raising the cost of gold lending, carry trading, and market-making.
Three separate sources of artificial supply are contracting at the same time.
This does not mean gold will surge tomorrow. But it does mean the price formation mechanism for gold is quietly shifting gears — from a price systematically suppressed, toward a price that more genuinely reflects physical scarcity.
There is also a more practical implication worth noting: the gold lease rate can serve as a reference indicator for gauging stress in the physical market.
When lease rates spike suddenly from under 1% to 3%, 4%, or beyond, it signals an acute shortage of physical gold — someone urgently needs to borrow metal and cannot find it. In such conditions, spot prices tend to follow with upward pressure, because the inability to borrow gold typically reflects surging demand for physical outright.
Conversely, if lease rates remain depressed or even turn negative, it signals abundant willingness to lend — physical supply is relatively comfortable — and near-term price pressure may come from the supply side.
This indicator is not a crystal ball. It cannot tell you whether gold will be up or down tomorrow. But it can tell you which direction the structural balance of physical supply and demand is tilting.
And when you take everything laid out in this article together — the hand that has been pressing down on gold prices for thirty years is lifting, one finger at a time.
This is not a conspiracy theory, and it is not a guarantee that gold will rise forever. It is a simpler, more grounded observation: when a market's long-standing source of artificial supply is systematically disappearing, the equilibrium price has only one logical direction to search for a new balance — higher.
The direction is relatively clear. The only questions that genuinely remain unanswerable are two: at what price level will the new equilibrium settle, and how quickly will it get there? The magnitude and the timing cannot be predicted. But which way the scales are tilting is no longer hard to see.
Gold once sat silently in a vault, treated as a non-yielding, non-dividend-paying rock. Now it is being seen again — not only by central banks, but by you.
Disclaimer: This article is intended for investor education purposes only and does not constitute investment advice of any kind.
Recommended Articles






Comments (0)
Click the $ button, enter the symbol, and select to link a stock, ETF, or other ticker.