


Gold Price Forecast: Oil Price Breaking $100 Fuels Inflation Concerns, Will Gold Prices Fall Further?



AI Podcast


As of the Asian session on July 24, gold prices (XAUUSD) face downward pressure as surging Brent crude oil prices above $100 heighten U.S. inflation expectations. Rising Treasury yields and a stronger dollar diminish gold's appeal, while market bets for a September Fed rate hike intensify. Despite geopolitical risks, inflation concerns currently dominate safe-haven demand. Technically, gold is testing the $4,000 support level. A potential head-and-shoulders bottom on the 4-hour chart could signal a rebound toward $4,200 if the $4,021.65 level holds; a breach below this risks further correction toward $3,900.
TradingKey - As of the Asian session on July 24, gold prices ( XAUUSD) fell continuously during intraday trading, briefly approaching the $4,000 mark. Looking at the chart, gold prices rebounded this week from $4,000 to a high of $4,166.19. However, as oil prices continued to climb and Brent crude ( UKOIL) once again topped $100, gold prices came under pressure and fell back again amid expectations that US inflation would heat up once more, fueling market concerns.
Oil Prices Surpassing $100 Push Up Inflation Expectations, Fed Rate Hike Bets Suppress Gold Prices
From a fundamental perspective, the core factor influencing gold's trajectory recently has been the situation in the Middle East. With the conflict between the U.S. and Iran continuing to escalate, the market was already highly focused on shipping risks in the Strait of Hormuz, and the latest developments have further spread to the Red Sea route. Following the attack on Saudi oil tankers by Yemen's Houthi militants, the market fears that Middle East energy transportation risks are no longer confined to the Strait of Hormuz but are spilling over to another key maritime channel. Under this influence, Brent crude's closing price on July 23 topped $100, and surging energy prices have once again become a core risk for global markets.
For gold, under normal circumstances, an escalation in geopolitical conflicts boosts safe-haven demand. However, in this round of market action, the market is first trading oil prices and inflation, rather than simply buying gold for safety. A sharp rise in oil prices pushes up gasoline, transportation, and production costs, and could push U.S. inflation data higher again in the coming months. Because gold itself does not yield interest, the cost of holding gold increases once inflation risks drive U.S. Treasury yields up.
The rebound in the dollar and U.S. Treasury yields has further weighed on gold. The latest market data shows that the U.S. Dollar Index rose to near a three-week high, while the 10-year Treasury yield also climbed above an 18-month high. A stronger dollar increases the cost of buying gold for investors using other currencies, while rising Treasury yields diminish gold's attractiveness compared to bond assets.
Meanwhile, expectations for Federal Reserve policy have added to the pressure on gold prices. As oil prices broke through $100, the market has begun to worry once again that the U.S. disinflation process could be disrupted. The Federal Reserve will announce its interest rate decision next week. While the market widely expects rates to be held steady at this meeting, traders' bets on a September rate hike have clearly intensified. If Fed Chair Warsh continues to emphasize inflation risks and policy flexibility in the post-meeting address, gold could continue to face upward pressure from rising real interest rates.
In addition, the latest U.S. tariff policies have exacerbated inflation concerns. The Trump administration announced new tariffs on approximately 60 trading partners, raising market fears that rising import prices will push U.S. inflation even higher. For the gold market, tariffs themselves may trigger safe-haven sentiment; however, if their ultimate result is to lift inflation and strengthen hawkish Fed expectations, it will exert pressure on gold.
Gold Price Technical Analysis: $4,000 Support Tested Again, Can Inverse Head and Shoulders Pattern Push Gold Price Above $4,200?
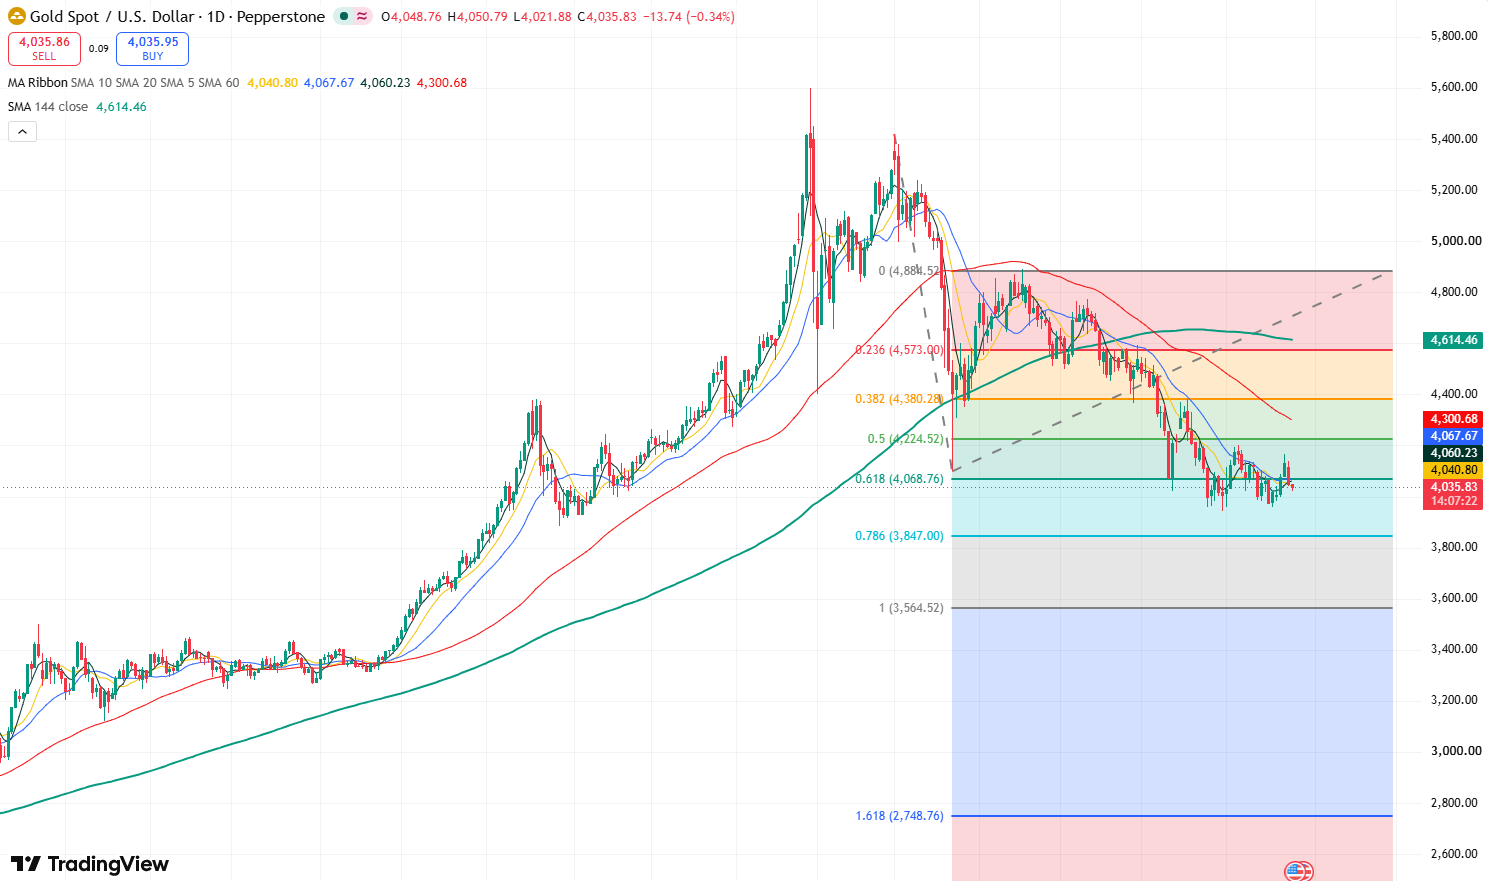
Gold price daily chart, Source: TradingView
According to the daily chart of gold, gold prices staged a strong rebound this week from the $4,000 mark to $4,166.19, hitting a near two-week high and driving a recovery in bullish market sentiment. However, under pressure from continuously rising oil prices, gold prices fell back and may test the support at the $4,000 mark downward again.
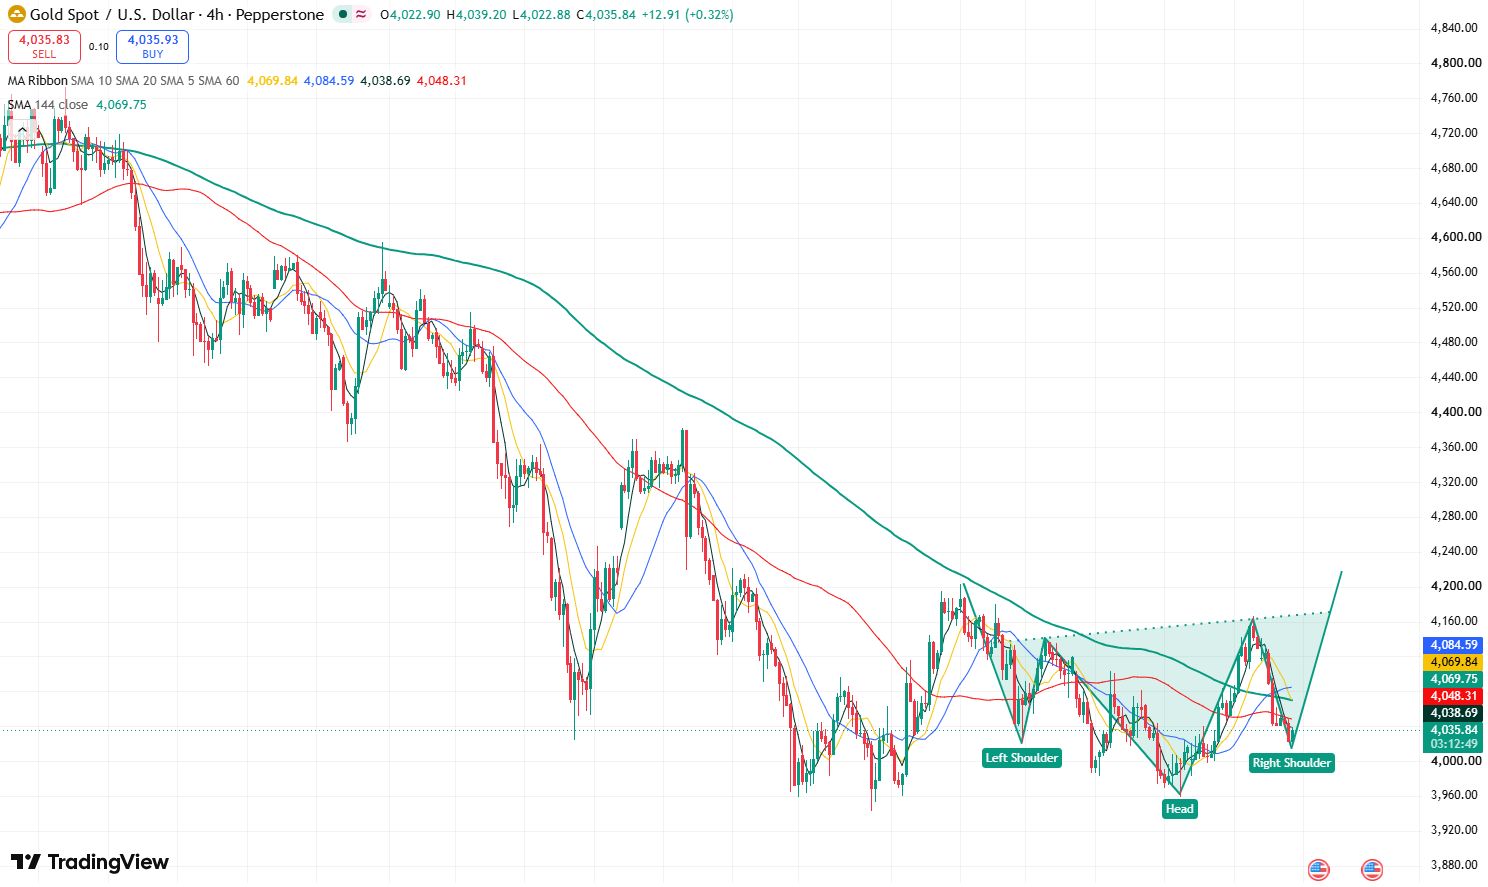
Gold price 4-hour chart, Source: TradingView
According to the 4-hour chart of gold, gold prices fell to an intraday low of $4,021.88, which did not break below the July 8 low of $4,021.65, and subsequently began to rebound. This indicates that the candlestick structure is expected to form the embryo of a head-and-shoulders bottom, with $4,021.65 as the left shoulder, $3,959.25 as the head, and $4,138.31 as the neckline. If this current 4-hour line confirms a halt to the decline and stabilizes, the head-and-shoulders bottom structure will be established, meaning short-term bullish momentum will be significantly enhanced, and the primary upside target for gold prices will be a breakout above $4,200.
Conversely, if gold prices break below $4,021.65 today, they will enter a deeper short-term correction phase, first testing the $4,000 mark downward, with the potential to fall further to $3,900.
This content was translated using AI and reviewed for clarity. It is for informational purposes only.
Recommended Articles










Comments (0)
Click the $ button, enter the symbol, and select to link a stock, ETF, or other ticker.