


Alphabet (GOOGL) Price Forecast: Up 14% From Post-Earnings Low, Eyes $364 Resistance at 17x P/E



AI Podcast


Alphabet shares have rebounded 14% from their July 24 low, currently trading near $360 after breaking key moving averages. Despite ongoing concerns over massive capital expenditure, the stock trades at a 17.87x trailing P/E, its lowest since 2019, contrasting with 24% revenue growth and 82% Cloud expansion. A strategic $15 billion data center partnership with Anthropic reframes infrastructure spending as demand-backed rather than speculative. With a $514 billion backlog and strong analyst consensus (average target $426.95), technical momentum points toward $364.23, though overbought RSI levels suggest potential short-term consolidation before further upside.

TradingKey - Alphabet (NASDAQ: GOOGL) stock closed at $356.65 (+ 6.88%) after surging to $360.21 in after-hours trading. It rebounded 14% from the post-earnings low of $315.04 reached on July 24. Alphabet stock crossed the 50 Days Moving Average ($341.48) and the 100 Days Moving Average ($351.43) and broke the previous Swing High of $353.84.
The targets for the current leg of the move using the Fibonacci extension are $364.23. The stock is trading with a trailing P/E of 17.87, which is Alphabet’s lowest P/E multiple since 2019 for a company with a 24% revenue growth and an 82% growth in the Cloud business.
The new news is a $15 billion Nexus Data Center Campus in Texas sponsored by Google to guarantee Anthropic with Finance and Chips. The stock is rated a Strong Buy from 58 analysts with an average price target of $426.95.
Analysis of Recovery Justification
There are three categories of concerns regarding the sell-off. First, we have the $44.9 billion of capex. There was and still is concern over Alphabet's demand for spending on investments in the absence of demand. The EPS (earnings per share, $9.11) headline, indicated $6 to $7 per share of unrealized gains from Anthropic and SpaceX. Third, was a concerns pertaining to the credit quality of Alphabet, as expressed by Moody's. Recovery from $315 to $360 was fueled by developments, also, in three categories.
- First, on July 30, Microsoft reported Azure growth at 43% with a $678 billion contracted backlog. Microsoft’s AI infrastructure capex demonstrated justified demand and returns, serving as a sector template that Alphabet did not have.
- Second, on July 30, Amazon’s CEO stated that AWS demand will exceed supply for the next 5 years, confirming the supply constraint that Google Cloud’s 82% growth and $514 billion backlog implied.
- Finally, the demand for AI substantiated the recovery, as Alphabet, Amazon, and Microsoft’s combined market value grew by $1.5 trillion.
Capital expenditure concerns have not improved. Alphabet guides $195 to $205 billion per year, and negative free cash flow persists. A positive sector development has been reframing AI infrastructure spending from being speculative to demand-constrained, which has eased the discount being taken.
Given Alphabet's trailing earnings, post-Q2 earnings trading was at 24% sales growth year over year and 17.87x earnings. Given Alphabet's 5 year median earnings multiple, the discount was significant. Shareholder value creation, post-Q2 earnings call, was even more impressive given that the stock was up 88% year over year prior to the selloff.
The New Anthropic Campus — What Google's Backing Means
A post Q2 earnings call development that supports the investment thesis is that Nexus Data Centers is in advanced negotiations to have $15 billion funded for a 1.6 gigawatt Anthropic related data center in Texas. Google is the financial backer and chip supplier. Goldman Sachs is one of a number of banks who are in negotiations for financing. This is similar to Amazon's investment into OpenAI.
Google's infrastructure agreements allow a contractual financing obligation to be established, securing financing for the campus, and solidifying their role as infrastructure supplier for one of the two most commercially important AI labs.
For Alphabet, strategically, this shifts capital expenditure worries into an argument for revenue and ecosystem gains. If Google covers Anthropic's data center needs and provides chips, those expenses fall under capex, but return as Cloud revenue when Anthropic uses Google to run its workloads.
Oracle gained 7% on the same week’s Google AI partnership framework expansion, showing Google’s enterprise AI partnerships are driving revenue to many companies. The Cloud's $514 billion backlog, which was up more than $50 billion in just one quarter in Q2, shows this type of financially committed multi-year deals.
GOOGL Technical Setup
Currently, GOOGL stock is trading at $359.89, achieving a very bullish price action on the 4-hour time frame. GOOGL stock was able to break above the 50 EMA at $341.48, 100 EMA at $351.43, and the last swing high at $353.84.
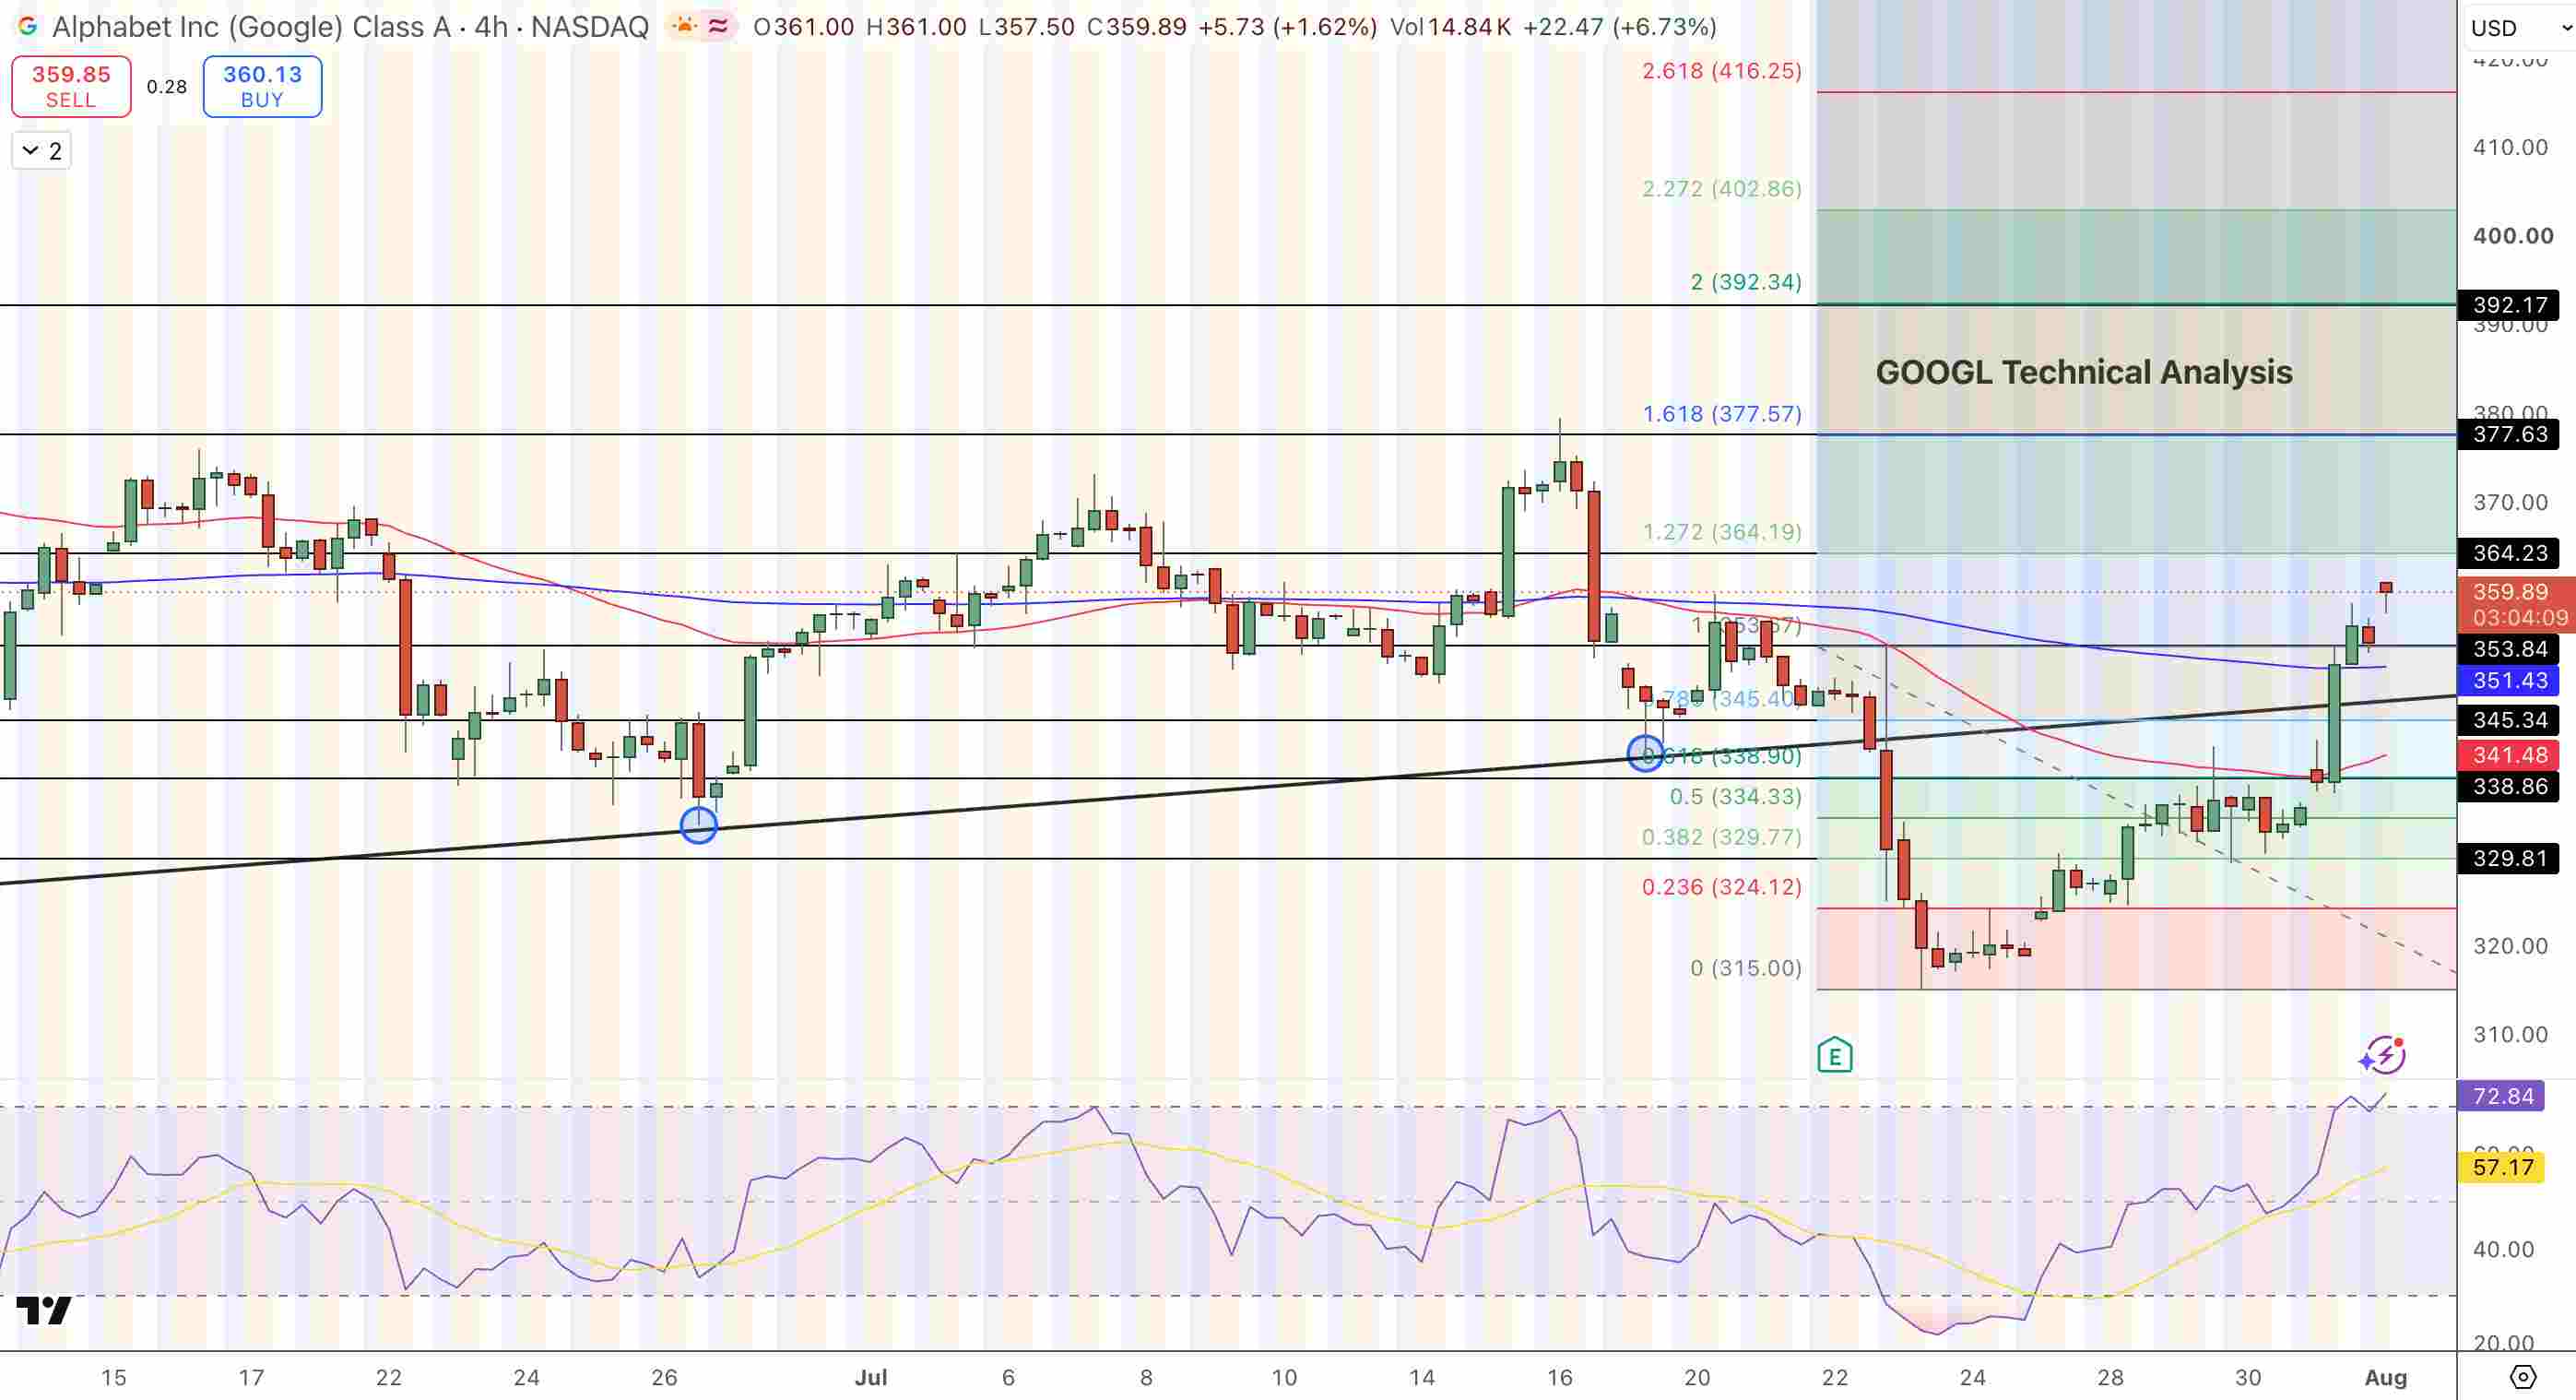
Alphabet (GOOGL) Price Chart - Source: Tradingview
Currently, GOOGL stock is in the overbought territory, and most likely will experience a short term price consolidation, RSI is above 70 and GOOGL stock consolidated sharply. The next immediate price target is $364.23, which is the 1.272 Fibonacci extension level. A break above this level will clean the path for GOOGL stock to reach $377.63, $392.17, and then $402.86.
On a price pullback, GOOGL stock will find mean reversions at $353.84, $345.34, and $338.86. The all time high closing price of GOOGL stock is $402.38 which occurred on May 13, 2026. The 52 week all time high price is $408.61.
Key Levels
- Recovery: More recently low post earnings was $315.04 (July 24) and now is $359.89 (up 14%). More recently closed July 31 at $356.65 (up 6.88%).
- Q2 confirmed: Revenue $119.8B (up 24%). Cloud was up 82% to $24.8B with margin 35.6%. Backlog was $514B (up $50B sequential).
- Valuation: P/E 17.87x - lowest since 2019 with trailing 24% revenue growth. Market cap $4.36T.
- New development: Google is backing $15B Nexus/Anthropic Texas campus (1.6 GW). Google is committing to guarantees of power and lease obligations.
- Analyst target: Target is $426.95, strong buy (58), sell (0). High is $515, low is $340.
- EMAs cleared: 50 EMA $341.48, 100 EMA $351.43, reclaimed, and a swing high of $353.84 was broken.
- Resistance: $364.23 (1.272 Fib), $377.63, $392.17, $402.86.
- Support: $353.84, $345.34, $338.86, $329.81.
Why Is Alphabet at 17x P/E When Its Cloud Is Growing 82%?
Alphabet’s trailing P/E of 17.87x is the lowest level since 2019, resulting from a post-earnings drop from $374 to $315 due to concerns of rising capex. This discount of Alphabet's 24% revenue and 82% Cloud growth (with a 35.6% margin) and a $514 billion contracted backlog is unnatural considering the level of Microsoft's ~32x forward P/E. The difference to the $426.95 58-analyst mean (implying ~21x P/E) adds to the core investment thesis. The target differs for Alphabet due to concerns on capex v. free cash flow or if Cloud growth continues in H2 with infrastructure investments.
What Does Google Backing the Anthropic Texas Campus Mean?
Google's backing of Nexus Data Centers' $15 billion Texas campus provides Anthropic with infrastructure partner status. This means Anthropic can route workloads through Google. This creates revenue and traffic for Cloud and GPU networking. The capacity built by Google's $195 to $205 billion annual capex, as referred to in a previous filing, provide guarantees for Anthropic. This adds to its $514 billion backlog.
Bottom Line
Alphabet has gained 14% off the $315 post-earnings low to $359. It has regained both of the EMAs and is heading toward the $364.23 Fibonacci resistance. A P/E of 17.87x, the lowest it has been since 2019, is for a company with a 24% revenue increase with a $514 billion backlog and 82% Cloud growth. The $15 billion Anthropic campus guarantee shows the capex is for committed customer infrastructure and not speculative capacity. An RSI above 70 means a consolidation near $364 is likely before continuing the trend. The average of 58 analysts stands at $426.95. The recovery relies on the $353.84 level, and a breakout past $364.23 would target $377.63, with a further all-time high range of $402 to $408.
Recommended Articles







Comments (0)
Click the $ button, enter the symbol, and select to link a stock, ETF, or other ticker.