


Australian Dollar dips under 0.6850 as Fed-RBA policy divergence widens



- AUD/USD falls 0.27% below 0.6850 despite positive market sentiment.
- December Fed hike odds reach 87% for a 25-basis-point increase.
- RBA expected to pause tightening, with markets pricing 2027 rate cuts.
The Australian Dollar lost 0.27% against the US Dollar on Wednesday as market participants priced in further Federal Reserve tightening, amid a light economic docket in Australia and the US. The AUD/USD trades below 0.6850.
AUD/USD extends losses as persistent US inflation reinforces Fed rate hike expectations
Sentiment remains positive as US stocks post solid gains. In the FX markets, the US Dollar Index (DXY), which tracks the performance of the buck against a basket of six currencies, gains 0.67% to 102.91, retreating after hitting an 18-month high of 102.96.
The Greenback appreciated after hawkish remarks by Federal Reserve (Fed) officials on Tuesday. Fed Governor Christopher Waller comment that if core CPI rose by 0.3% could prompt him to support a 50-basis-point rate hike was fulfilled once the data was known.
Underlying inflation in October increased 0.3% MoM, for the third straight time. Headline CPI increased by 0.4% MoM, down from 0.6%, but above estimates of 0.3%.
Money markets had priced in an 87% chance of a 25 bps rate hike and a slim 13% chance that the Fed may go for a 50 bps hike, according to the CME FedWatch Tool.
Consequently, AUD/USD is edging lower, amid speculation that the Reserve Bank of Australia (RBA) has finished its tightening cycle and is poised to hold rates for the foreseeable future. In fact, the RBA is expected to cut rates by 28 basis points in 2027, according to Prime Terminal data.
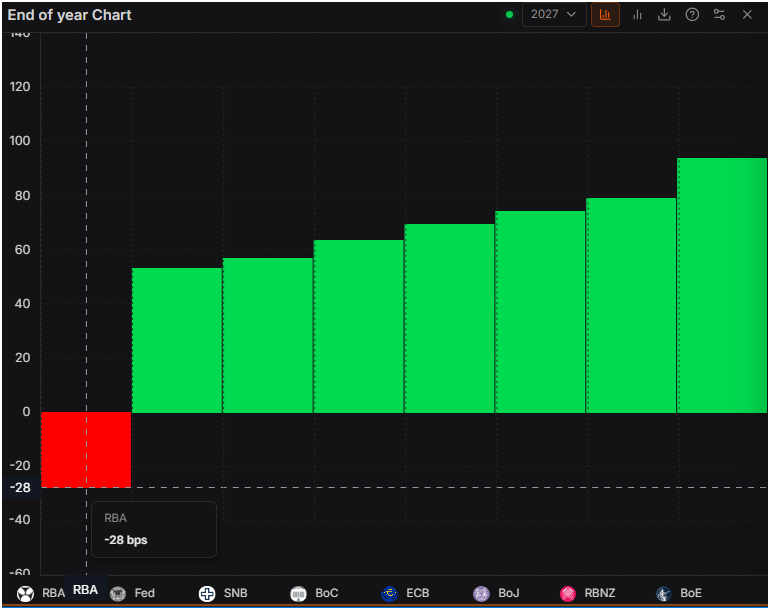
Ahead, the Aussie economic docket will feature Consumer Inflation Expectations for November, with October’s print coming in at 5.3%, up from September’s 4.9%.
In the US, investors are preparing for Thursday’s Initial Jobless Claims release, housing data and Fed speeches, ahead of Friday’s Producer Price Index (PPI).
AUD/USD Price Forecast: Technical outlook
In the daily chart, AUD/USD trades at 0.6844, keeping a bearish near-term bias as spot holds well beneath the cluster of simple moving averages (SMA) around 0.7028 and a series of former rising trend lines that now act as overhead barriers. The break under the most recent rising support line, which now comes in as resistance near 0.6926, underscores persistent downside pressure, while the Relative Strength Index (14) at about 35 points to weak but not yet oversold momentum, suggesting sellers remain in control unless price can regain those broken structural levels.
On the topside, initial resistance is located at the former rising trend line around 0.6926, ahead of the confluence of the 50-, 100- and 200-day SMAs near 0.7028; a daily close above this band would be needed to ease immediate bearish pressure and open the way to 0.7135 and the horizontal barrier at 0.7198. On the downside, firm structural support does not emerge until the long-term descending trend line turned base around 0.6343, leaving the pair vulnerable to further grinding losses while it remains capped below the aforementioned resistance cluster.
(The technical analysis of this story was written with the help of an AI tool. Know more.)
Australian Dollar Price Today
The table below shows the percentage change of Australian Dollar (AUD) against listed major currencies today. Australian Dollar was the strongest against the Swiss Franc.
| USD | EUR | GBP | JPY | CAD | AUD | NZD | CHF | |
|---|---|---|---|---|---|---|---|---|
| USD | 0.68% | 0.51% | 0.57% | 0.44% | 0.32% | 0.72% | 0.93% | |
| EUR | -0.68% | -0.17% | -0.09% | -0.24% | -0.36% | 0.03% | 0.22% | |
| GBP | -0.51% | 0.17% | 0.08% | -0.09% | -0.19% | 0.20% | 0.39% | |
| JPY | -0.57% | 0.09% | -0.08% | -0.15% | -0.25% | 0.14% | 0.34% | |
| CAD | -0.44% | 0.24% | 0.09% | 0.15% | -0.09% | 0.28% | 0.47% | |
| AUD | -0.32% | 0.36% | 0.19% | 0.25% | 0.09% | 0.40% | 0.61% | |
| NZD | -0.72% | -0.03% | -0.20% | -0.14% | -0.28% | -0.40% | 0.19% | |
| CHF | -0.93% | -0.22% | -0.39% | -0.34% | -0.47% | -0.61% | -0.19% |
The heat map shows percentage changes of major currencies against each other. The base currency is picked from the left column, while the quote currency is picked from the top row. For example, if you pick the Australian Dollar from the left column and move along the horizontal line to the US Dollar, the percentage change displayed in the box will represent AUD (base)/USD (quote).







