


CoreWeave: Blowout results, defying frothy pricing. Can NVDA's protégé rise?


AI infra 'new cloud' unicorn $Coreweave(CRWV.US) released its Q3 results after the U.S. close on Nov 10. On a standalone basis, the print was solid: revenue and backlog both re-accelerated and beat, margins kept improving, and Adj. OPM, per management, hit double digits one quarter ahead of plan. Full-year guidance was also raised across the board. Specifically:
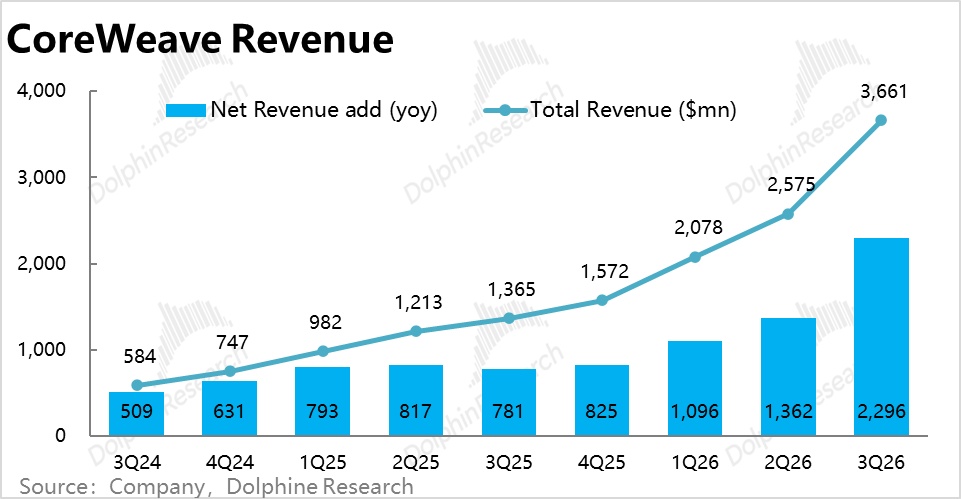
1) Revenue: up $1.1bn QoQ, growth re-accelerated
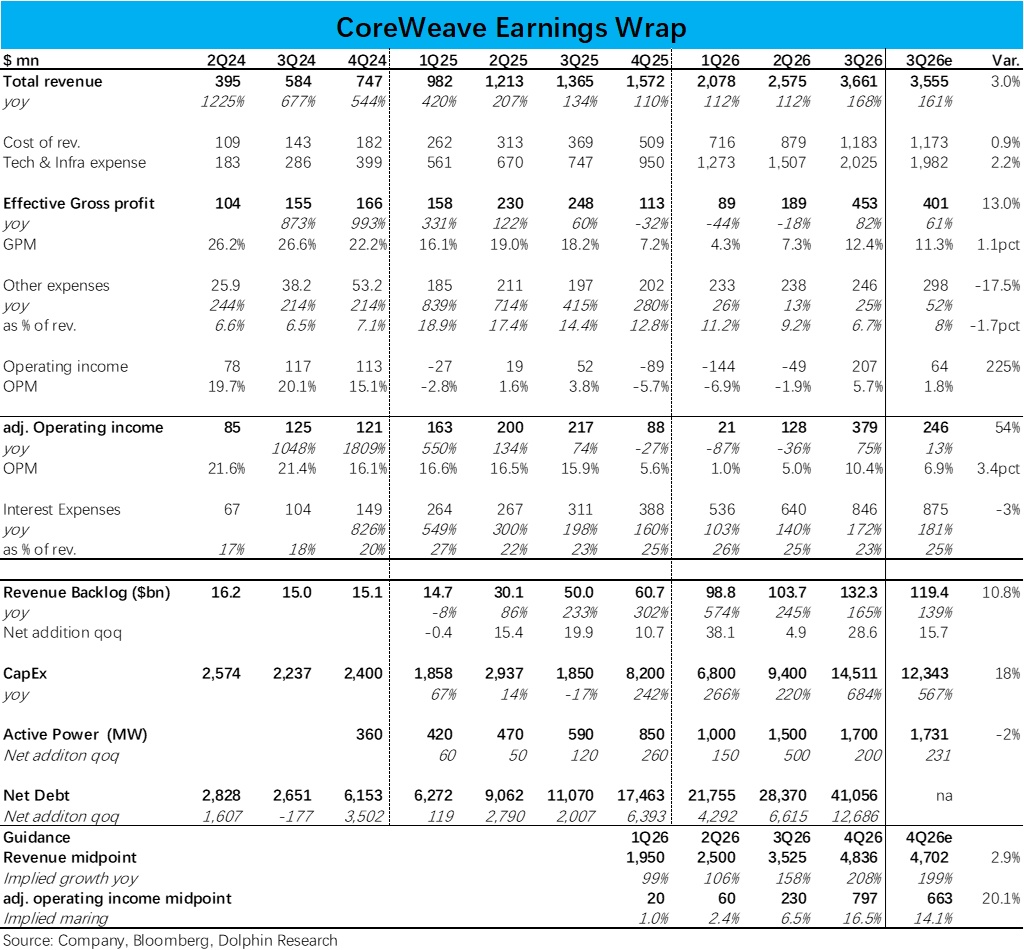
3Q26 revenue was $3.66bn, implying a net QoQ increase of about $1.09bn, more than double last quarter. It beat consensus by ~3% and topped the high end of guidance at $3.6bn, marking robust growth.
The company attributed the strength to favorable pricing and strong demand. On the call, management confirmed a ~25% price hike across models in Jul, followed by another ~10% later in the quarter, with further price increases in 4Q that outpace cost inflation. Pricing for prior-gen 'old cards' (Ampere, Hopper, etc.) also rose 30%–50% QoQ this quarter, above legacy contract rates.
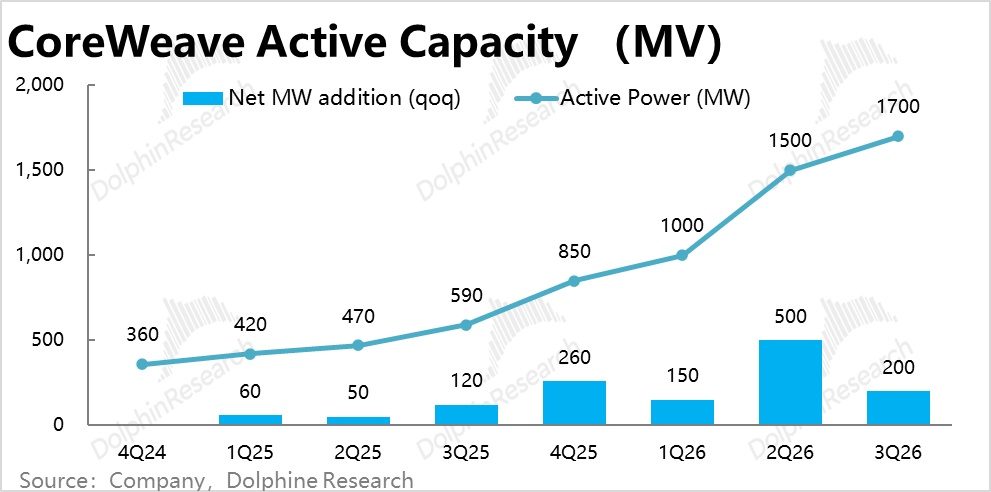
On volume, active power capacity increased by only ~200MW this quarter (vs. ~500MW last quarter), which is not fast. Therefore, the revenue beat likely reflects a large tranche of capacity added late last quarter that began generating revenue in this quarter.
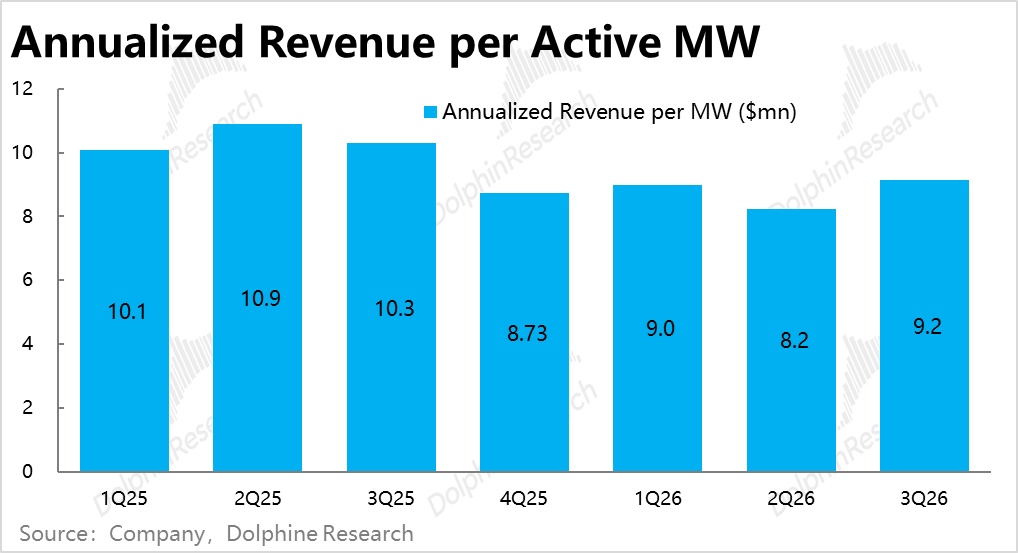
On an Avg. active power basis, annualized revenue per MW was about $9.15mn this quarter, up meaningfully from roughly $8.24mn last quarter. This corroborates higher leasing prices from the financials. In short, the rear-view mirror shows compute demand is strong and supply remains tight.
2) Backlog: nearly $29bn added in one quarter, driven mainly by long-dated deals
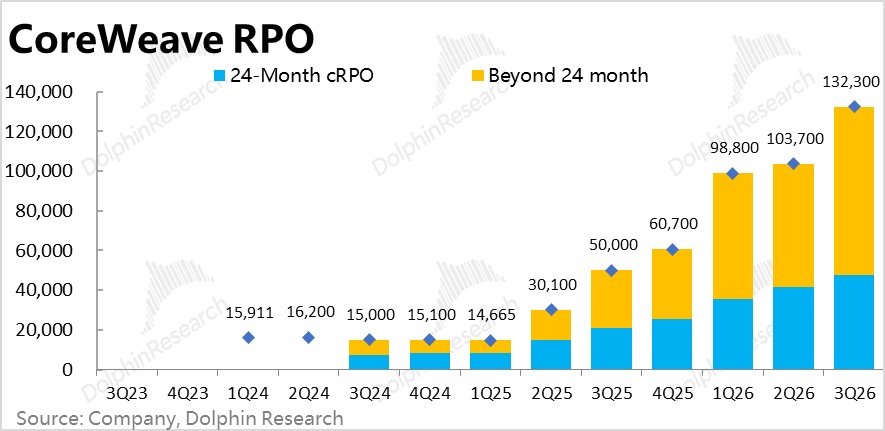
RPO ended the quarter at $132.3bn, up about $28.6bn QoQ, the second-largest quarterly increase on record (after 1Q26). It was ~11% above consensus. Not only did revenue beat, new orders were also very strong.
Management said new orders came from both existing and new customers, with a more diversified mix. More than half of new customers this year came from AI labs and non-tech industries.
By tenor, the share of contracts longer than 24 months rose by 4ppt, while the QoQ net add in short-dated deals was roughly flat vs. last quarter. The strong order growth this quarter was mainly driven by contracts of 2 years or longer.
3) Capacity on-stream and Capex: activations in line, Capex pulled forward and above guidance
Active power exceeded 1.7GW by quarter-end, roughly in line with consensus (about 1,731MW). Quarterly net adds were over 200MW, a notable slowdown vs. last quarter. The company maintained its year-end active power target of over 1.85GW, implying only ~150MW of net adds in 4Q and a year-end level below the consensus ~1.91GW.
Thus, despite strong revenue, the pace of capacity build was not fast. This quarter’s revenue was more driven by capacity that came online late last quarter.
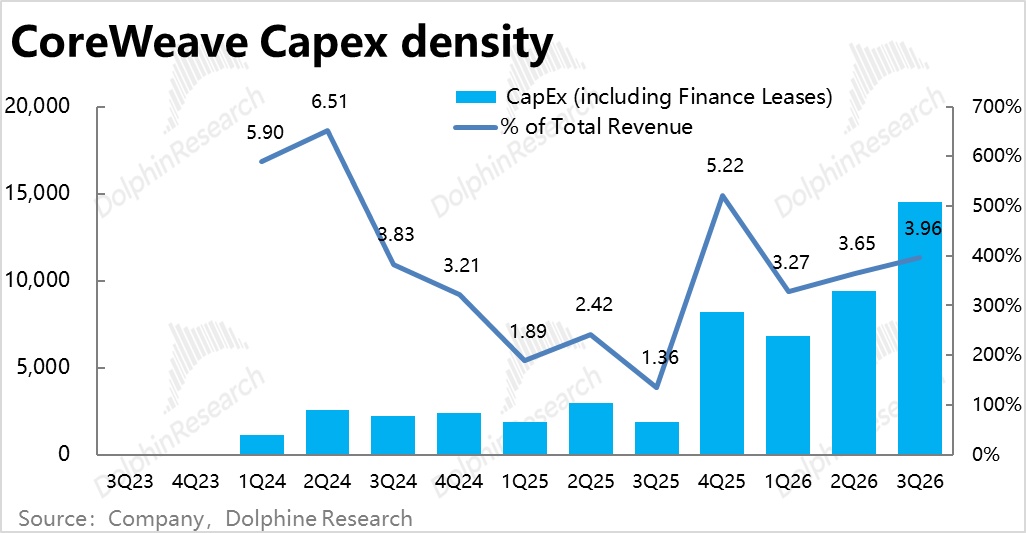
However, Capex (incl. finance leases and net of CWIP changes) reached $14.5bn, well above market expectations and the guidance high end of $13.5bn. The Capex-to-revenue multiple climbed to nearly 4x. It highlights mounting investment needs to support revenue growth.
While the CFO said part of 4Q spending was pulled into 3Q, Dolphin Research believes unit build cost per MW also rose (hardware inflation). Rough math suggests 2026 unit costs are up by about 20%–25% vs. 2025.
4) Margins: Adj. OPM about 10%, reaching double digits one quarter early
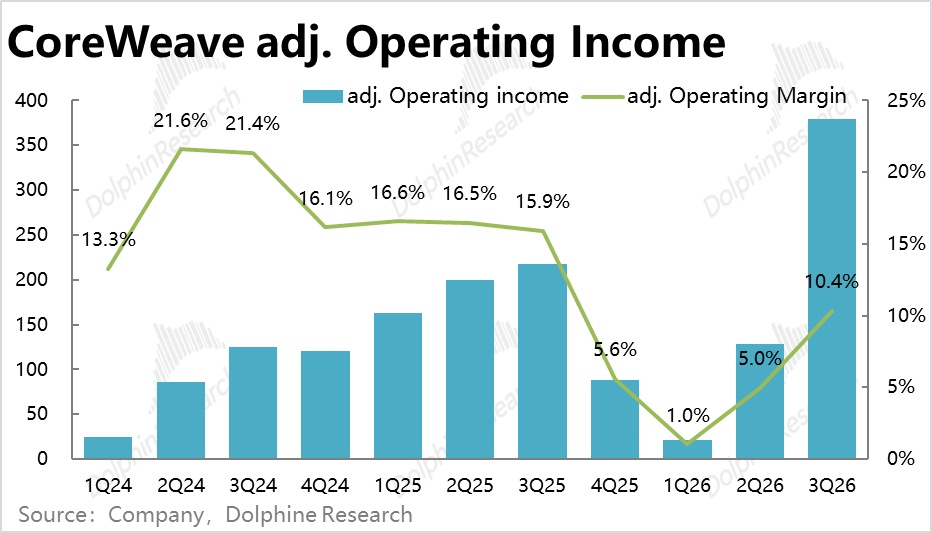
Adj. operating profit was $379mn, implying a 10.4% margin, well above the 6.9% consensus. This met management’s double-digit OPM target one quarter early.
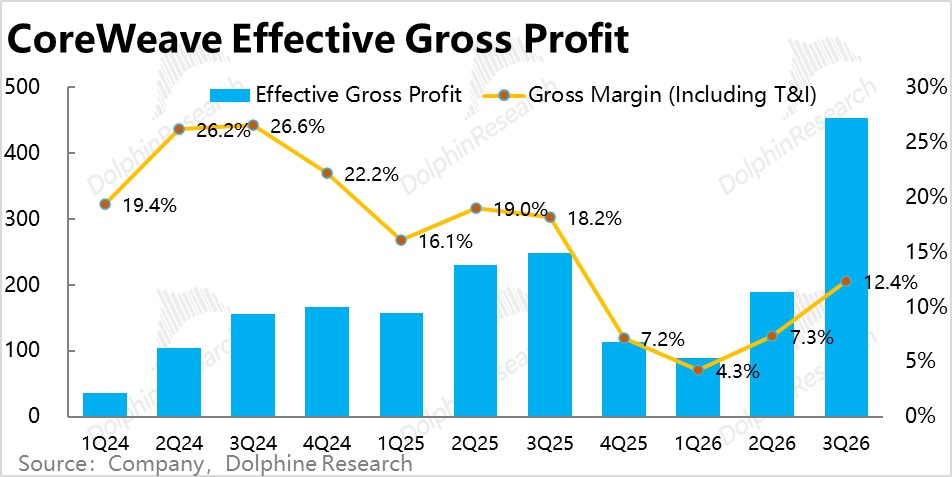
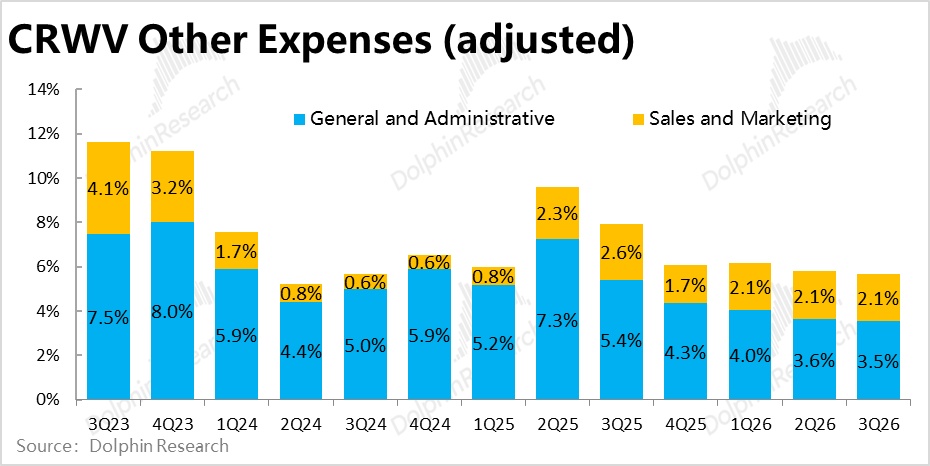
Excluding COGS and T&I (infrastructure build R&D), the 'underlying GPM' was about 12.4% vs. ~7.3% last quarter, though still below ~18% a year ago. Improvement mainly came from depreciation within T&I falling as a share of revenue, from 54.1% to 51.6%. In addition, operating cost ratios for energy, rent, and headcount fell by about 1.8ppt QoQ, and S&M remained low and was further diluted by revenue growth.
Based on management commentary, Dolphin Research sees the margin beat and ongoing improvement as driven by two factors: higher lease pricing (primary) and scale benefits as revenue rises.
The CFO said they allocated available capacity to higher-margin short-term contracts, which 'contributed meaningfully' this quarter. Current short-term deals can annualize above $40mn/MW, while new 4–5 year contracts have risen to $20–25mn/MW. Short-term deals recover cash in 6–18 months, and long-term deals recover hardware Capex in roughly 1–2 years.
5) Interest and financing: interest below guide, but debt rose by about $12bn in one quarter
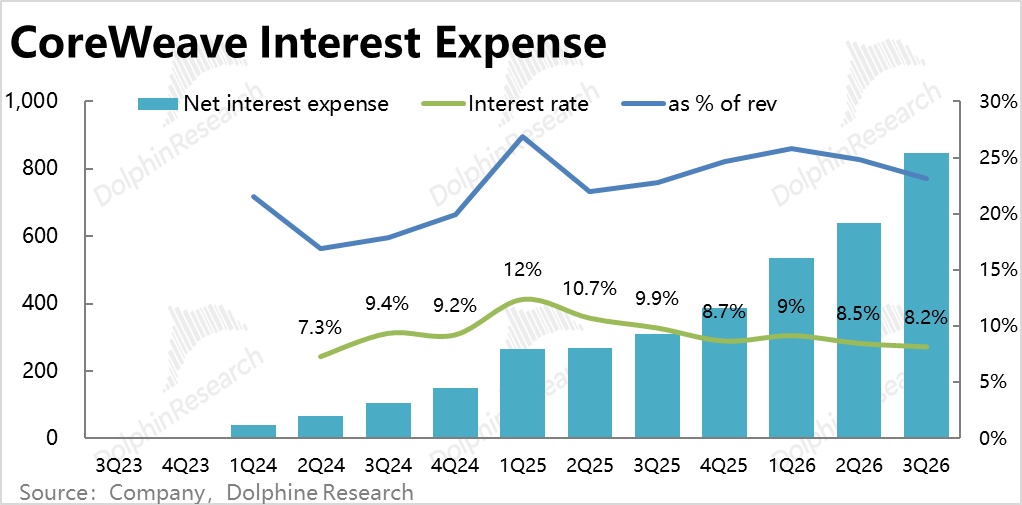
Net interest expense was $846mn, below the guidance low end of $860mn. A rough interest-to-Avg. total debt calculation suggests the Avg. rate fell from 8.5% to 8.2%, which also reduced interest as a share of revenue.
Unlike the recent broad rise in new cloud issuance costs, the effective rate on outstanding debt moved lower on a rear-view basis, which is a surprise. This reflects history, so prudence on future interest burden is still warranted. Adj. operating profit still does not cover interest, meaning earnings do not yet cover the cost of debt capital.
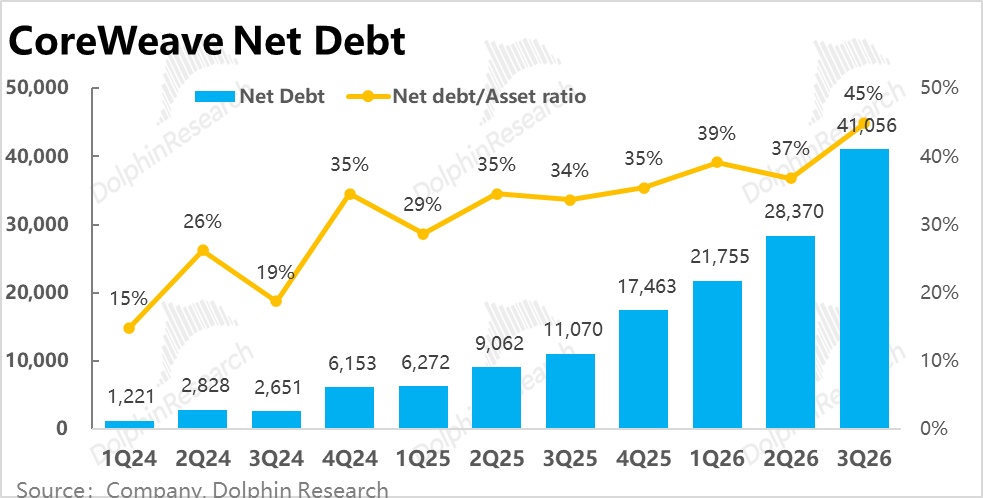
Despite slightly lower interest, total debt (incl. finance leases) reached about $47.5bn at quarter-end. The single-quarter increase was roughly $12.2bn, a record high. Financing pressure has not eased, as Capex needs keep climbing.
6) 4Q and full-year outlook: revenue and profits raised, 4Q interest to climb further
Full-year guidance implies 4Q revenue of $4.69–4.99bn, about 3% above the $4.70bn consensus. At the high end, this implies a ~$1.3bn QoQ increase and continued acceleration vs. this quarter.
Adj. operating profit guidance implies 4Q of $750–850mn, about 20% above the $660mn consensus at the midpoint. This equates to an OPM of roughly 16.5%, indicating a further step-up in margins. Year-end ARR guidance was raised from $18.5–19.5bn to $20–21bn, vs. consensus of about $18.9bn.
However, 4Q interest expense guidance of $1.05–1.15bn is about 9% above the $1.01bn consensus midpoint. It is up roughly 30% vs. this quarter and broadly in line with the QoQ revenue growth, so interest as a share of revenue is not clearly declining.
7) Key metrics at a glance; see call noteshere
Dolphin Research view:
1) Quarterly results summary
Judging by revenue, orders, next-quarter revenue guide, and steadily improving margins, CoreWeave’s fundamentals are trending better. Demand is strong, prices are rising, and margins are moving higher. On the flip side, the 'cost' to support the business is also increasing: debt rose by about $12bn in one quarter, interest still exceeds Adj. OPM, Capex surged, and FCF is deeply negative.
The market’s key focus, and what valuation will ultimately reflect, is whether demand can hold into 2027 and beyond and whether today’s high leasing prices (reflecting scarcity) might reverse. These cannot be answered by a strong near-term print. The market may reward this report modestly, but it will not deliver a full-on narrative reversal.
2) Outlook: near-term trend remains upward
Near term, the growth drivers are clear: 4Q guidance implies another ~30% QoQ revenue increase, Adj. OPM around 16.5%, and year-end ARR raised to $20–21bn. Management also said pricing continues to rise in 4Q.
Looking further out, the company for the first time offered a profitability timetable. Adj. net loss narrows materially in 2027, and Adj. net income turns positive in 1H28 and for full-year 2028.
3) Core questions
Core Q1: unit pricing is rising, but 'renewals worth more' assumes persistent scarcity
This quarter’s growth leaned more on price than volume. As discussed, capacity adds were modest, while revenue per MW rose sharply, and 4Q guidance implies further uplift. It remains a seller’s market, and CoreWeave is allocating more capacity to higher-priced short-term deals, with price elasticity flowing straight through to margins.
Looking ahead, management cited two supports: by end-2027, qualified demand is 10x available capacity and 2027 supply is essentially sold out. Also, legacy GPUs rolling off first-term contracts could add nearly $4bn to annualized revenue in 2027 at today’s prices, and close to $10bn in 2028, and those assets carry no further depreciation, implying higher margins.
Both supports require continued scarcity and elevated lease rates. With new industry supply concentrated in the next 1–2 years, that assumption may not hold.
Core Q2: shifting financing to customers largely alleviates funding constraints
While the rate on outstanding debt has fallen, the market cares more about the marginal cost of funds, which has risen. The yield on unsecured notes climbed from ~11% in Aug to above 15% in Oct, and the Sep convert carried a higher coupon than in Apr.
Management’s response is to pivot funding to customers: no new unsecured issuance at the HoldCo level through 2027. Future Capex will be mainly financed by DDTLs (delayed-draw term loans secured by customer orders) and customer prepayments. On the call, management said 70% of deals this year had prepayments, with some customers prepaying up to 100% of contract value. They expect less than $5bn of incremental HoldCo funding needs by end-2027.
In essence, the biz. model is becoming more 'as-a-service' for clients. Financing is tightly tied to customer orders and credit, so once an order is signed, prepayments and DDTLs follow and funding arrives. This largely resolves the market’s biggest concern over financing, at the cost of reduced bargaining power and autonomy.
This model requires tight supply and large customers needing and willing to buy compute from new cloud providers. If that premise loosens, orders, prepayments, and funding channels could all contract, pointing to the same risk as Core Q1.
Core Q3: the peak of investment and financing lies ahead, with an option to slow
Capex spiked partly due to pull-forward, and the full-year guide implies 4Q Capex below consensus. But unit build cost is rising, meaning the same activation scale requires more dollars.
Our model suggests Capex peaks in 2028–2029, with the largest funding gap likely in 2027. The build and spend peak, and the associated peaks in cash burn, total debt, and interest burden, are only in the early climb. Management noted that if they only deliver signed backlog, 2027 Capex would be roughly flat YoY, implying that if funding conditions worsen, they can slow expansion and stop signing many new deals to ease cash and funding pressure.
4) Forecast changes, valuation, and investment view
Earnings revisions: post-print, we raise 4Q and full-year per guidance. We also lift unit price growth from 2028 onward and assume customer prepayments cover about half of Capex, reducing incremental borrowings and interest materially. Under the new assumptions, Adj. operating profit in 2028 is about $6.5bn, ~13% above prior, but ~16% below consensus.
Key assumptions include:
i) Capacity: year-end active power of ~4.6GW.
ii) Pricing: annualized revenue per MW of about $11.0mn, roughly 20% above ~$9.2mn in 2026.
iii) Margins: Adj. OPM of about 15%, with depreciation at ~48% of revenue and operating costs around ~28%.
Valuation: at the latest after-hours price of about $56.7 (up ~16% vs. pre-print close), market cap is ~$31.7bn. That implies roughly 6.1x our 2028 after-tax operating profit (at a 20% tax rate). Including net debt of about $41.0bn as of this quarter, EV is about 14x. On our projected net debt at end-2028, the EV multiple would be around 20x.
Downside case: applying a 16x EV multiple to 2028 after-tax operating profit and deducting our projected ~$70bn net debt at end-2028 yields equity value of about $12.7bn, or roughly $23 per share. This level is unlikely near term, but it illustrates substantial downside in a pessimistic case.
Note that high leverage makes equity value highly sensitive to multiples and debt assumptions. A 1x change in the multiple shifts per-share value by about $9.
On a P/EBIT basis, that price would equal roughly 2x 2028 Adj. operating profit, which looks optically low. But with high leverage, P/EBIT is distorted since OP must first cover large interest, so we anchor on EV metrics.
Investment view and stance: the print is strong and financing constraints are largely eased. But these results rely on a meaningful supply-demand imbalance, and if scarcity persists, the current growth trajectory suggests CoreWeave is near fair value. However, the durability of this premise is highly uncertain. Recent signals point to potential overbuild, and media report that Microsoft is trimming new cloud partners and chose not to renew with Oracle.
Given CoreWeave’s heavy revenue and funding dependence on a few large customers, that is not a good signal. The near-term numbers look vibrant, but if supply-demand flips, high leverage will amplify downside to equity. We suggest staying on the sidelines unless valuation approaches the bearish case above, or unless there is clear evidence of new AI demand sufficient to keep compute tight for longer.
Risk disclosure and statements:Dolphin Research Disclaimer and General Disclosure
Past Dolphin Research on 'CoreWeave'
Earnings reviews:
2026.11.11 Call 'CoreWeave (Trans)': price hikes and old-card renewals drove margins past 10% ahead of plan
2026.08.12 Earnings review 'CoreWeave: the inflection is here; can the tireless 'workhorse' finally earn?'
2026.08.12 Call 'CoreWeave (Trans)': margin inflection arrived, interest rising in tandem
2026.05.08 Call 'CoreWeave (Trans)': inference now accounts for over half of compute consumption
2026.05.08 Earnings review 'CoreWeave: compute sells well but profits are hard; Nvidia’s 'little helper' still grinding?'
2026.02.27 Call 'CoreWeave (Trans)': massive Capex fully tied to contracted services
2026.02.27 Earnings review 'CoreWeave: order surge, margin 'dive', and a profitability trap for the compute unicorn?'
In-depth research:
2026.08.13 'CoreWeave, Nebius: compute price hikes and backers step in; how long can Nvidia’s 'godson' run hot?'
2025.12.30 'CoreWeave: new cloud upstart or tireless 'workhorse'?'
2025.12.16 'CoreWeave: can Nvidia’s 'godson' truly benefit from its parentage?'
Recommended Articles










Comments (0)
Click the $ button, enter the symbol, and select to link a stock, ETF, or other ticker.