


Monster: Revenue fully charged, profits losing power — is the honeymoon over?


Monster Beverage (MNST) released its Q3 2026 results in the early hours of Nov 6 Beijing time (after market close on Nov 5 ET). Revenue beat again, with Intl still posting strong growth. However, a higher overseas mix, together with rising freight and fuel and stepped-up marketing spend, weighed on margins, driving YoY declines in GPM and OPM, with profit growth lagging revenue materially.
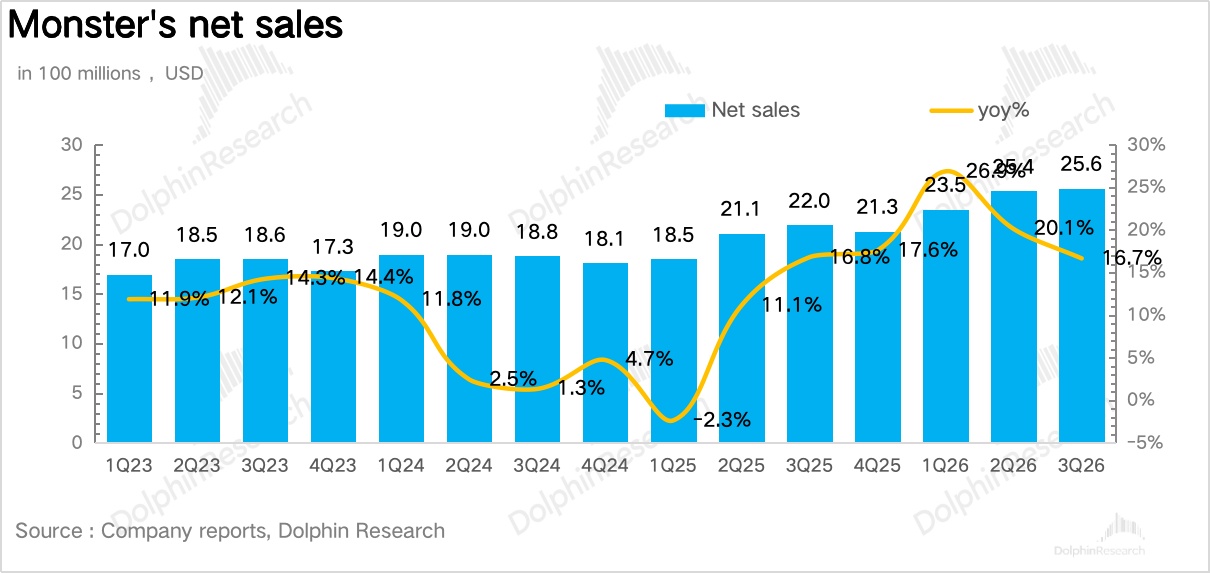
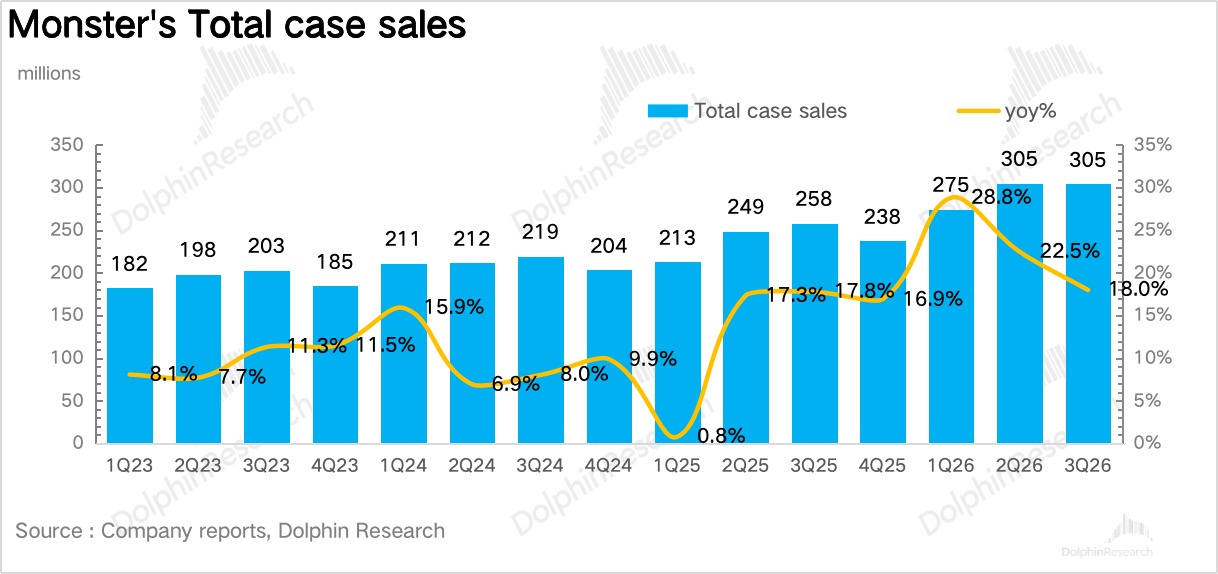
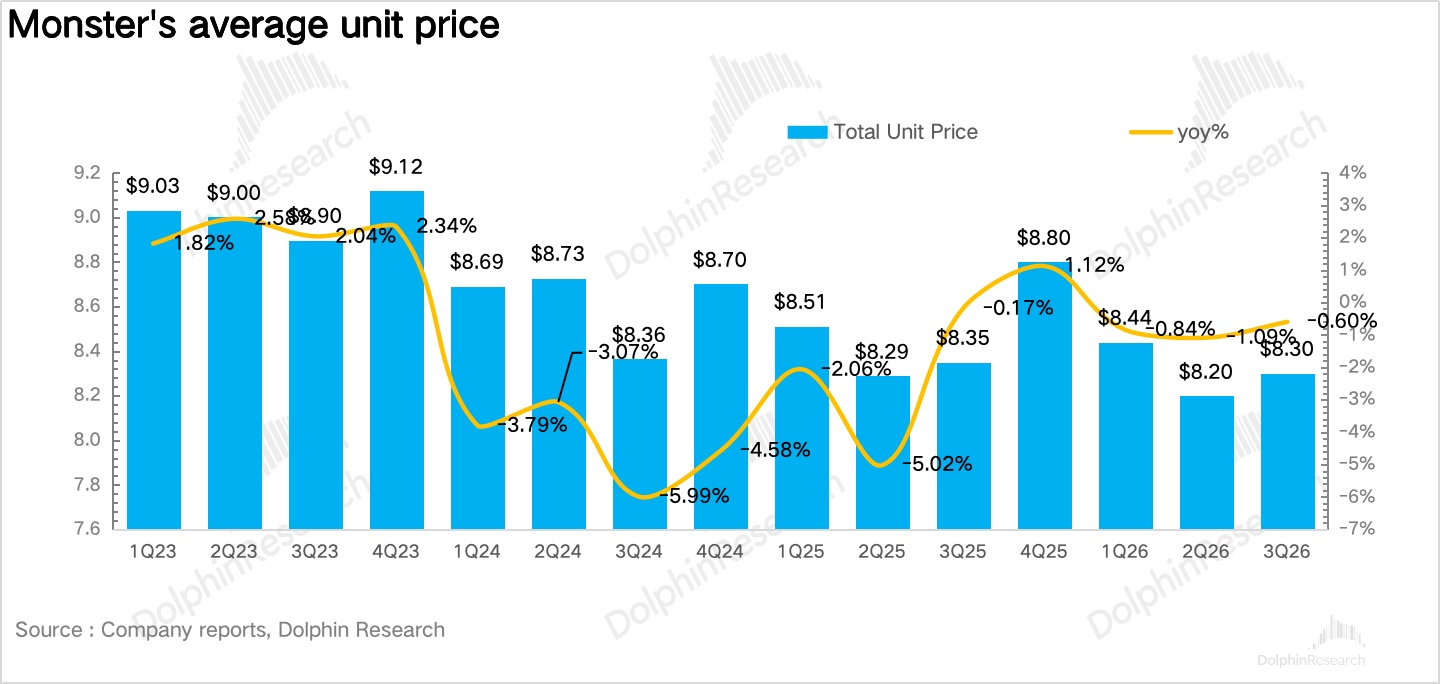
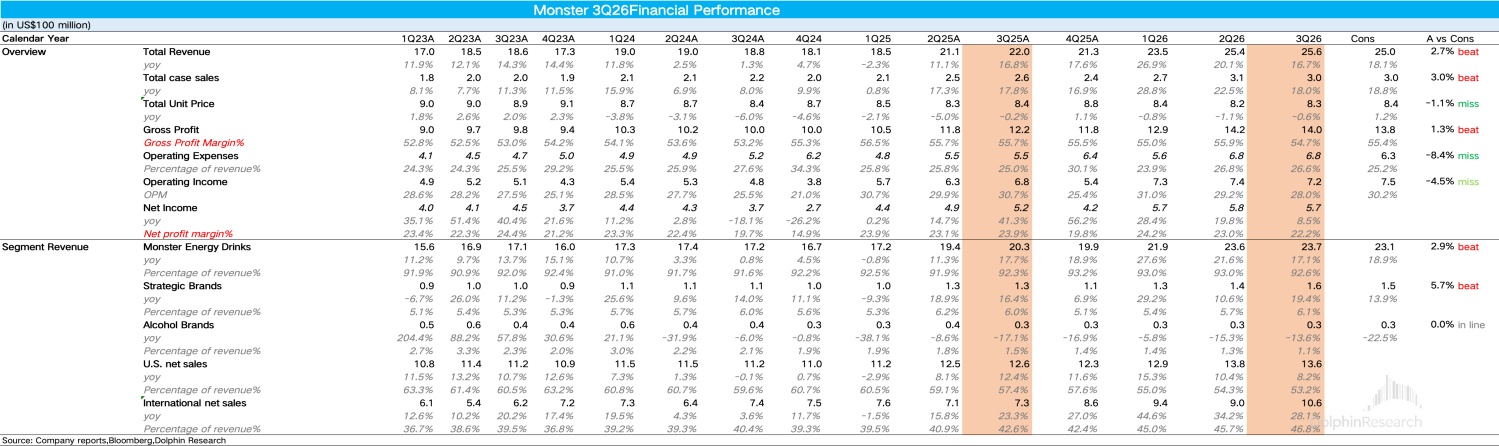
- Revenue beat; volume remains the primary driver. Q3 sales were $2.56bn, +16.7% YoY (consensus +13.5%), with FX contributing $8.1mn; ex-FX growth was +16.3%. By mix, unit case volume rose +18.0% YoY to 305mn cases, still the core driver; ASP per case fell 0.6% YoY to $8.30, a smaller decline vs. Q2. The key reason is the continued rise in lower-priced Intl mix (+4.2ppts to 46.8%).
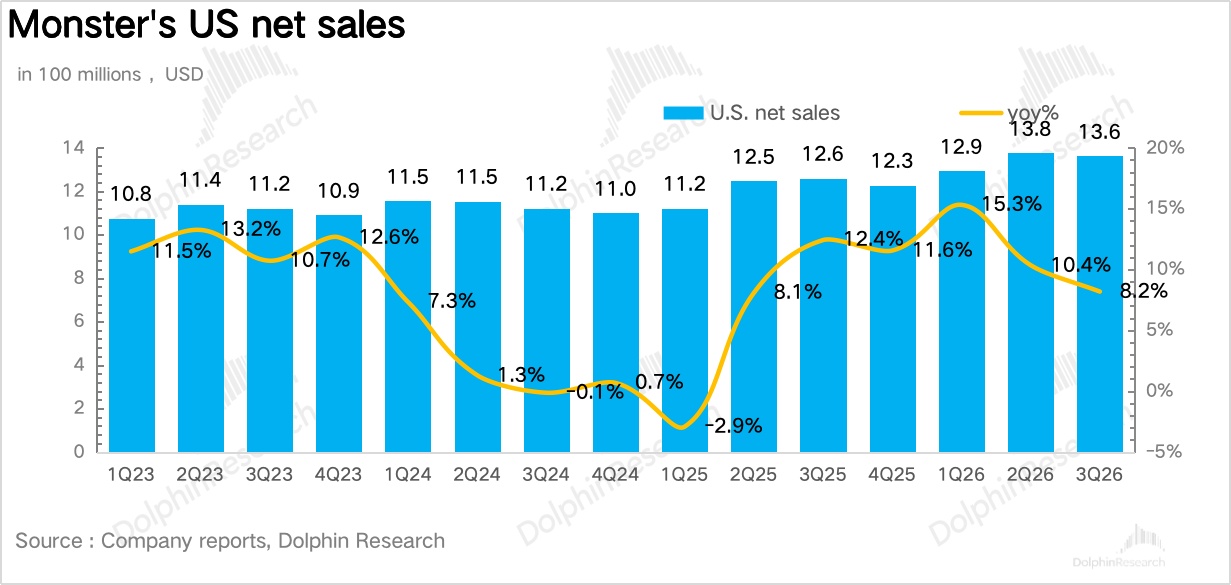
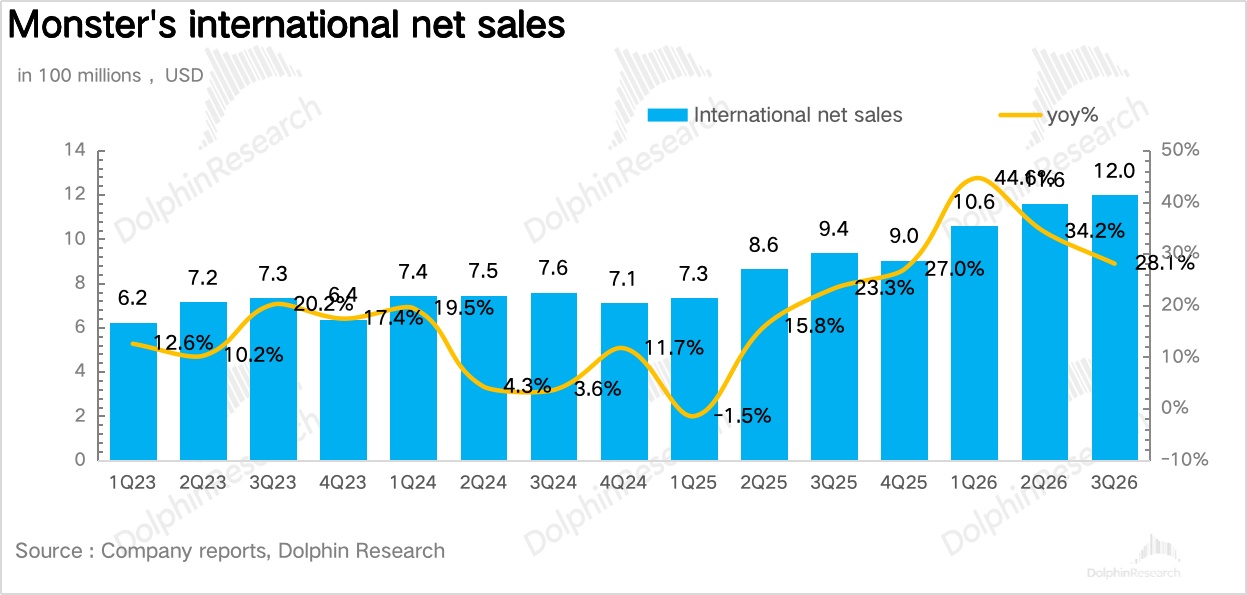
- LatAm posted standout growth. The U.S. delivered $1.36bn, +8.2% YoY (+9.5% on a U.S.+Canada basis), a slight deceleration vs. Q2 on a high base. Ultra (+19%) and Juice Monster (+21%) remained the main contributors. Intl rose +28.1% YoY, lifting mix to 46.8%; LatAm was the highlight at +49% (Brazil +70%), EMEA +25%, APAC +12.3%, with China and India relatively higher.
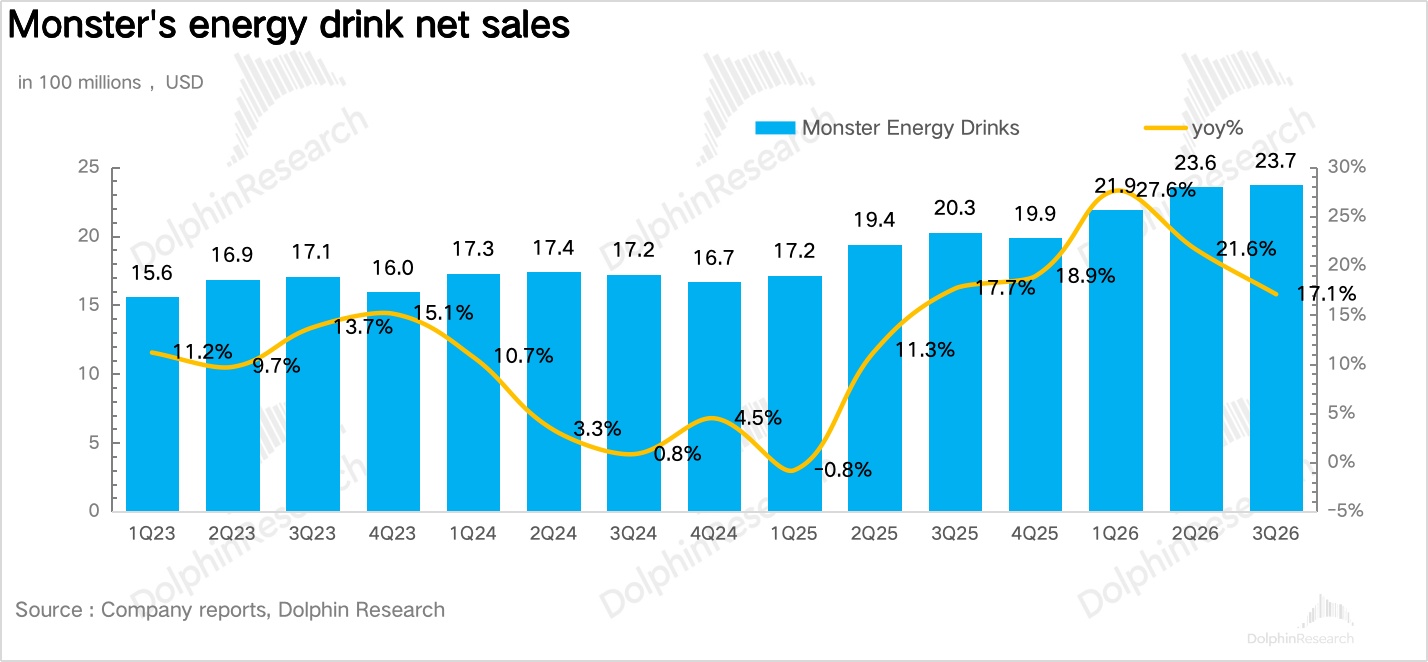
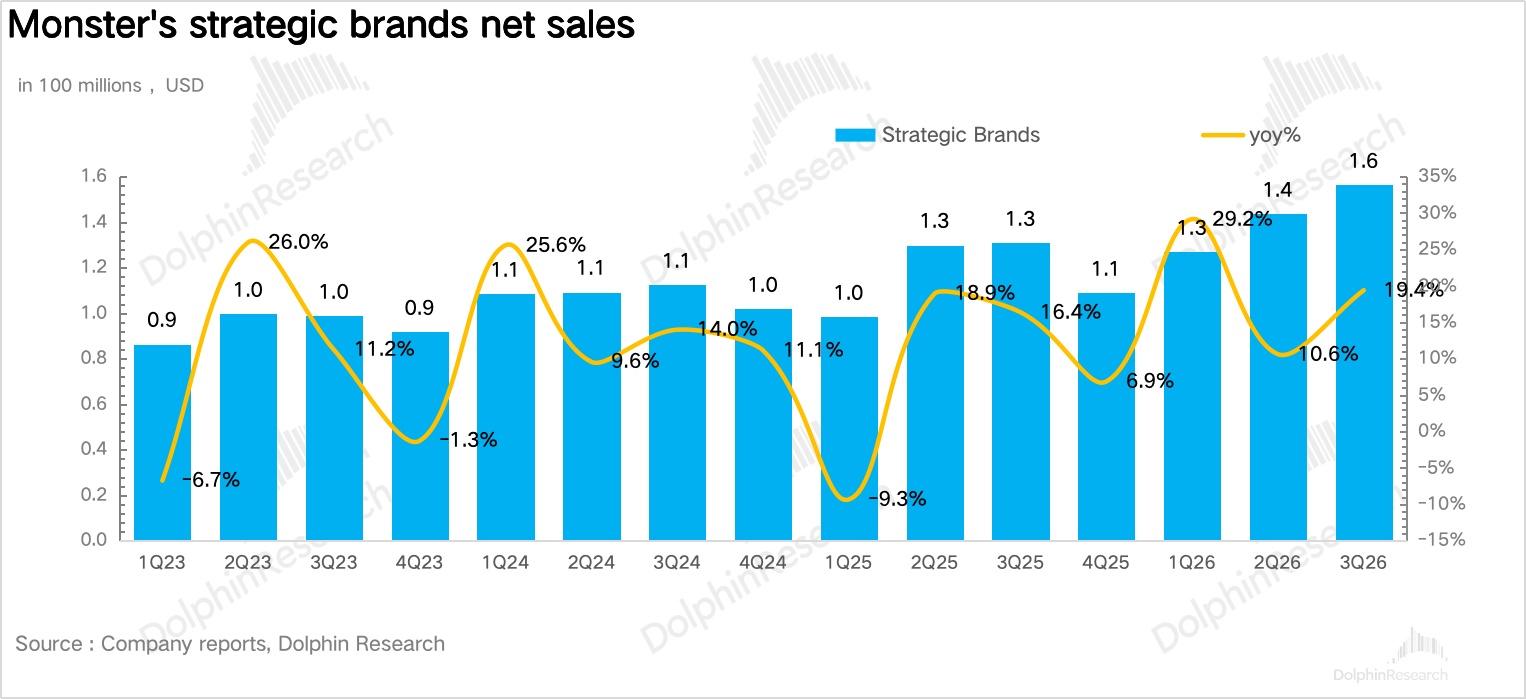
- Strategic brands accelerated; alcohol still a drag. The Monster core brand grew +17.1% YoY, slower than Q2. Strategic brands rose +20% YoY, with QoQ acceleration, driven by value brands Predator and Fury taking share in Egypt, Morocco, Nigeria, and other emerging markets. Alcohol brands fell 13.6% YoY, continuing to weigh on growth.
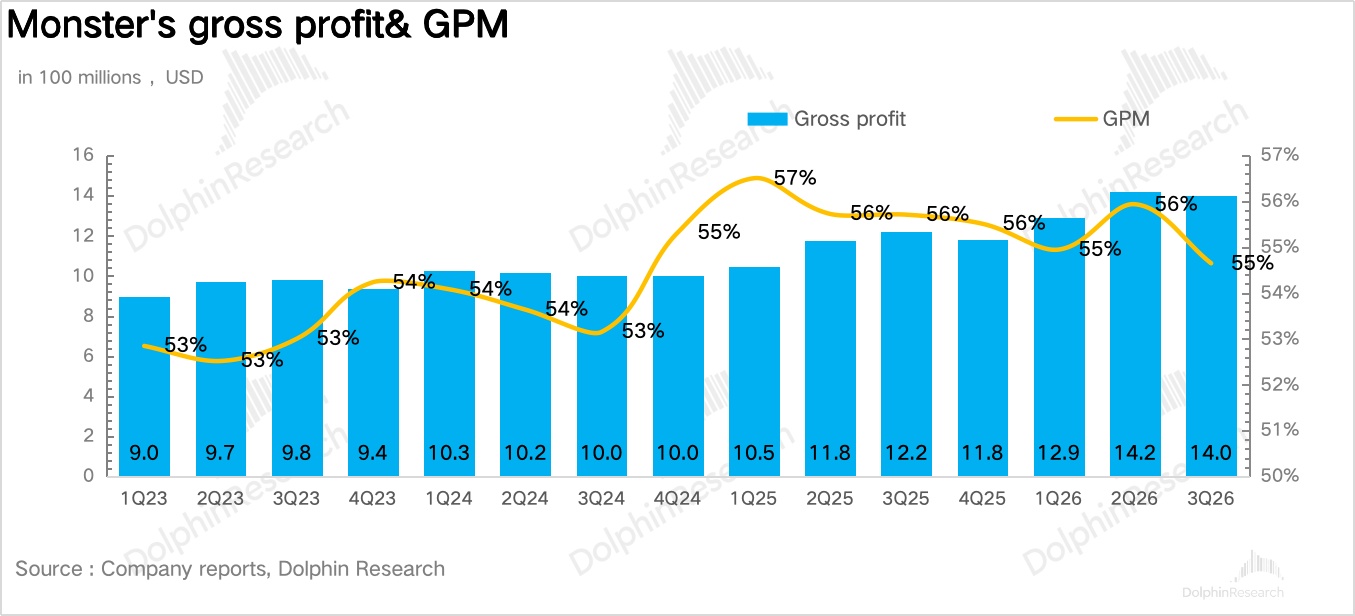
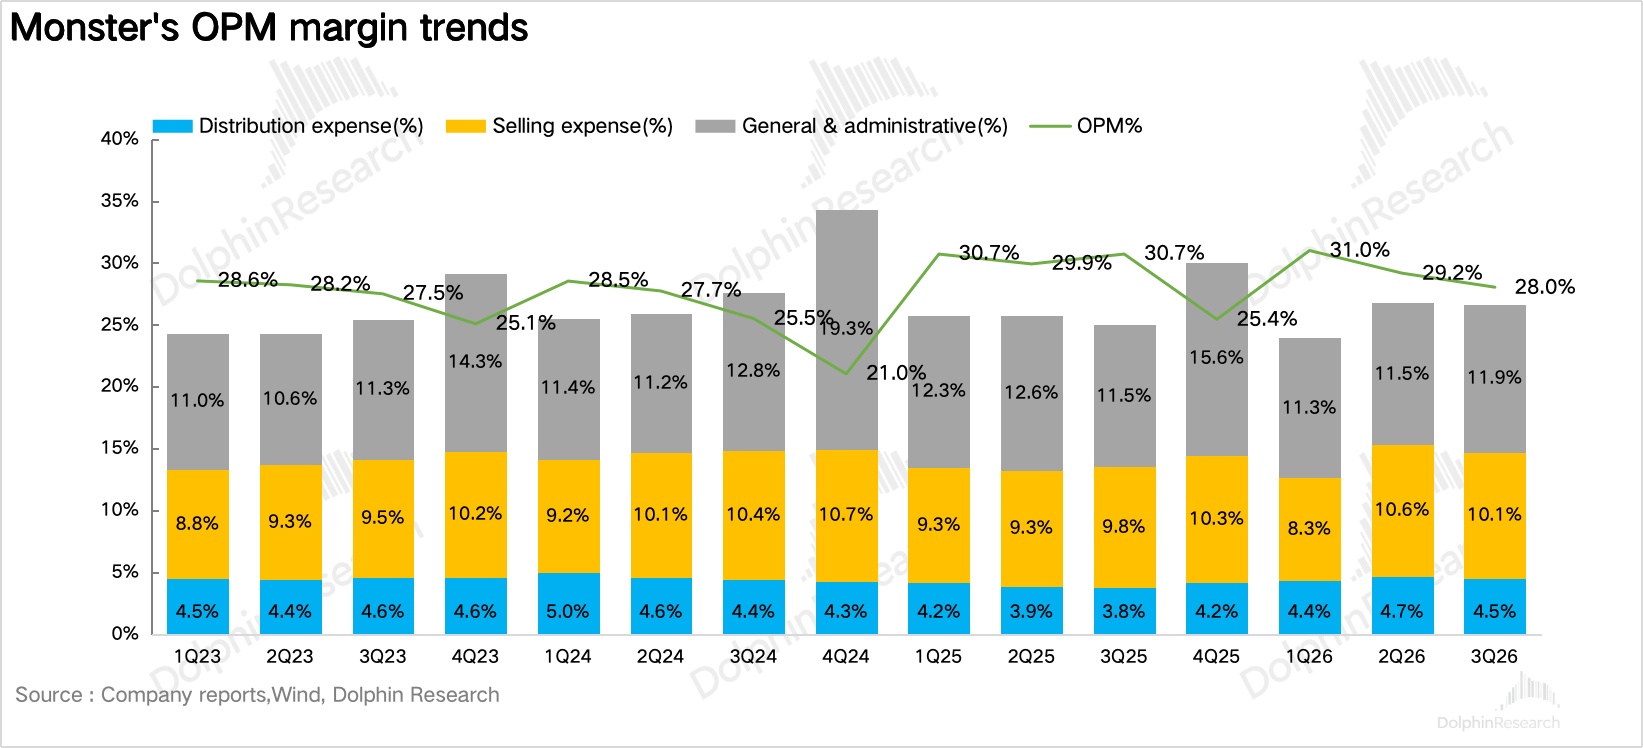
- Cost pressures emerged; profitability declined. Pricing actions before Nov largely offset higher input costs like aluminum cans. But a rising share of lower-margin overseas markets increasingly dragged the mix, taking GPM down 100bps YoY to 54.7%. On opex, higher freight and fuel pushed delivery costs up 40.8% YoY, while the company continued to invest in social/digital media and sports sponsorships to acquire and penetrate, lifting S&M expenses +21.2% YoY. OP grew only +6.4% YoY, with OPM down 270bps to 28.0%, meaning profit growth was less than half of revenue growth.
Oct growth cooled; pricing to offset cost pressure. The company does not provide guidance as usual but acknowledged the current environment as 'quite tough'. It disclosed Oct sales growth of +11.6% YoY, a further slowdown vs. Q3. In pricing, the U.S. raised ex-factory prices effective Nov 1 and reduced certain promotional allowances by pack and channel; EMEA implemented price increases in some markets in Q3 and will broaden to others in Q4.
- Financial metrics at a glance
Dolphin Research view:
Overall, the most acute issue this quarter is that revenue outpaced profit more noticeably than in Q2, which the market dislikes. Beyond that, from a marginal change perspective, several points merit attention.
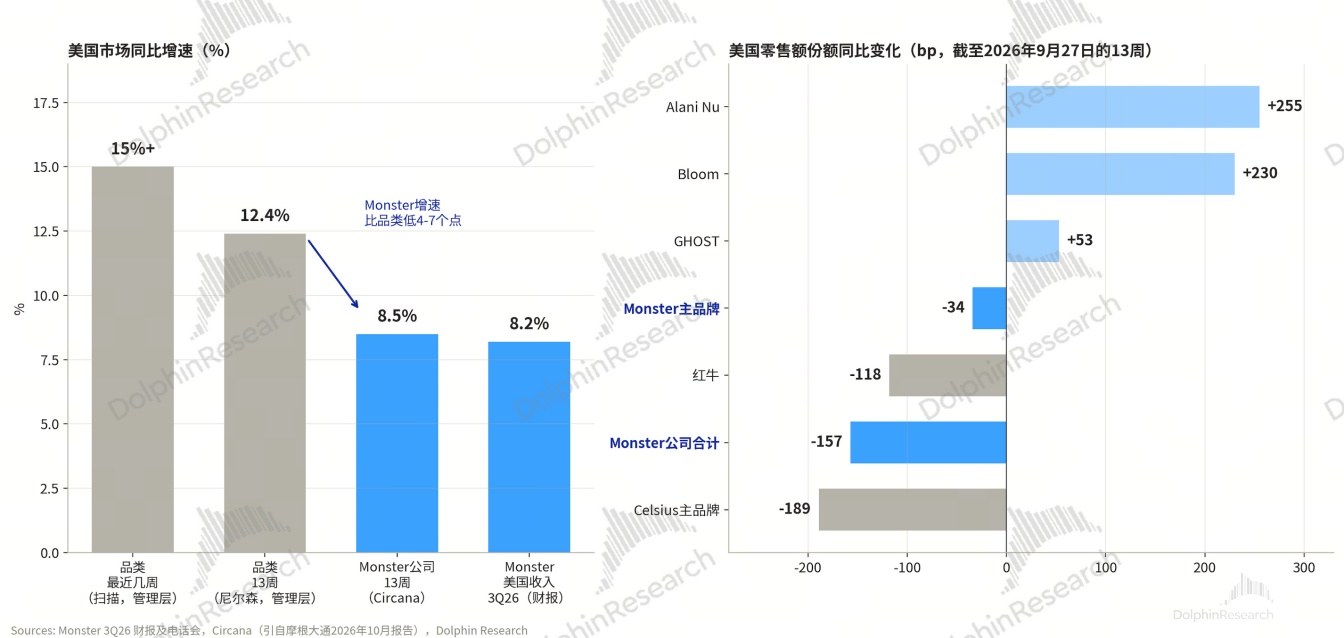
- U.S. energy category is re-accelerating, but Monster is lagging. Management noted that after a brief slowdown in late summer, the U.S. energy category has rebounded, with recent weekly scanner growth exceeding 15%. However, the chart shows Monster’s U.S. 13-week category growth at only 12.4% (Nielsen), clearly trailing the category, implying incremental gains are being captured by new brands like Alani Nu and Bloom.
Drilling down, the Monster core brand grew 12.5%, roughly in line with the category. The real laggards are tail brands such as Bang (-25%) and Reign (-22%). In other words, the core brand’s competitiveness remains intact, while the issue lies in the tail of the portfolio. Looking ahead, whether to keep investing to sustain these tail brands or to refocus resources on the core and new launches will directly shape Monster’s U.S. share trajectory.
Intl is the growth engine but also the main margin drag. Benefiting from the Coca-Cola bottling system’s distribution and rising penetration of value brands, management also highlighted that roughly 30% of energy category consumers in Europe each year are new entrants, indicating the category is still mainstreaming. The bigger issue is that several overseas regions run GPMs of 37%–48%, far below the U.S.; each ppt increase in overseas mix mechanically compresses the consolidated GPM.
While management declined to quantify the drag on the call, for a growth-priced name at ~40x, the market will focus on sustained GPM erosion. As the overseas mix nears 50%, this structural drag will likely persist into 2027.
For Q4, ex-alcohol Oct sales growth was ~11.6%. Even after accounting for one fewer selling day, that is a clear slowdown vs. 16%+ in Q3. Combined with the high base last Q4 (U.S. ~11%, Intl ~26%) and potential pre-price customer stocking that may have pulled forward demand ahead of Nov, we expect Q4 revenue growth of ~11%–13%.
Valuation: We estimate 2026 Adj. net profit at ~$2.29bn (with $1.75bn achieved in the first three quarters). At the ~$45 after-hours share price (market cap ~$88bn), this implies ~38x. Given cost pressure likely extends into Q1 next year, we trim our 2027 net profit estimate from ~$2.57bn to ~$2.53bn (+~11% YoY), implying ~35x, still notably above the ~33x 10-year Avg.
Thus, at the Dec 1 Investor Day, if management can provide a clearer mid-term margin framework and path to lift overseas GPM, it may ease concerns about 'revenue up, profit not'. Otherwise, at ~38x, continued margin slippage could further compress MNST’s premium. Ahead of that, we maintain a 'Hold, do not chase' view.
Appendix: Monster biz. overview
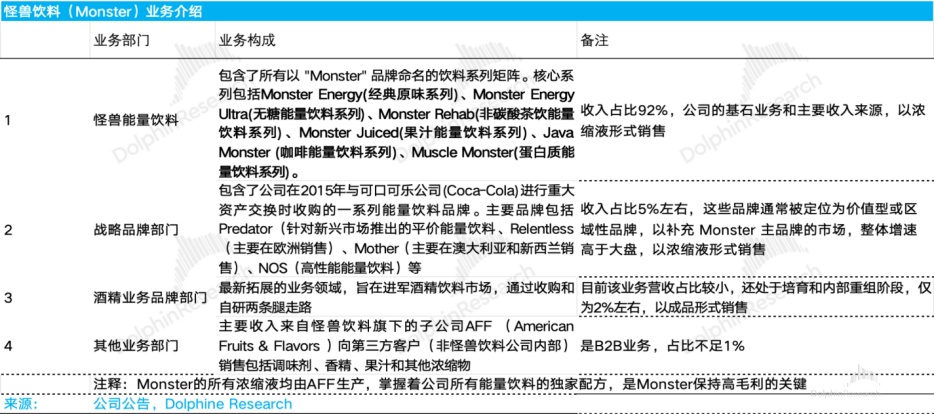
Per Monster’s disclosures, revenue can be broken down into Monster core energy, strategic brands, alcohol brands, and other. Details:
- Monster Energy Dept. The cornerstone and main revenue source, accounting for ~92% of sales. It includes all beverages under the 'Monster' brand. Core series include Monster Energy (original), Monster Energy Ultra (zero-sugar), Monster Rehab (non-carbonated tea-based energy), Monster Juiced (juice-based energy), Java Monster (coffee energy), and Muscle Monster (protein energy).
(2) Strategic Brands Dept. Primarily comprises energy brands acquired in the 2015 asset swap with Coca-Cola. Typically positioned as value or regional to complement the Monster core, including Predator (value brand for emerging markets), Relentless (mainly Europe), Mother (Australia/New Zealand), NOS (performance energy), etc. This segment is ~5% of revenue, growing slightly faster than the core.
(3) Alcohol Brands Dept. Monster’s newest area, entering alcohol via acquisitions and in-house development. Revenue contribution remains small at ~2%, with the business still in cultivation and internal re-org.
(4) Other Dept. The smallest contributor, primarily AFF (American Fruits & Flavors) sales to third-party customers (non-Monster) of flavorings, essences, and concentrates, i.e., B2B. Note that all Monster concentrates are produced by AFF, which holds the exclusive formulas for the company’s energy drinks and is key to sustaining high GPM.
Dolphin Research historical pieces:
Commentary: Aug 7, 2026 'Monster: Valuation Surge — How long can the sweet spot last?'
May 8, 2026 'Monster: Product cycle tailwind, Intl ignition — a sweet pivot?'
Feb 27, 2026 'Monster Beverage: A new product cycle ahead — another year of evolution?'
Deep dive:
Sep 11, 2025 'Monster: Besieged on all sides — will the former beast turn into a pussycat?'
Jul 23, 2025 'Monster: Taking on Red Bull — how a 100x beast was forged over 20 years'
Risk disclosure & statement: Dolphin Research disclaimer and general disclosure
Recommended Articles








Comments (0)
Click the $ button, enter the symbol, and select to link a stock, ETF, or other ticker.