


Goldman Sachs Group Inc Stock (GS) Moved Down by 3.20% on Mar 5: What Signal Does It Send?



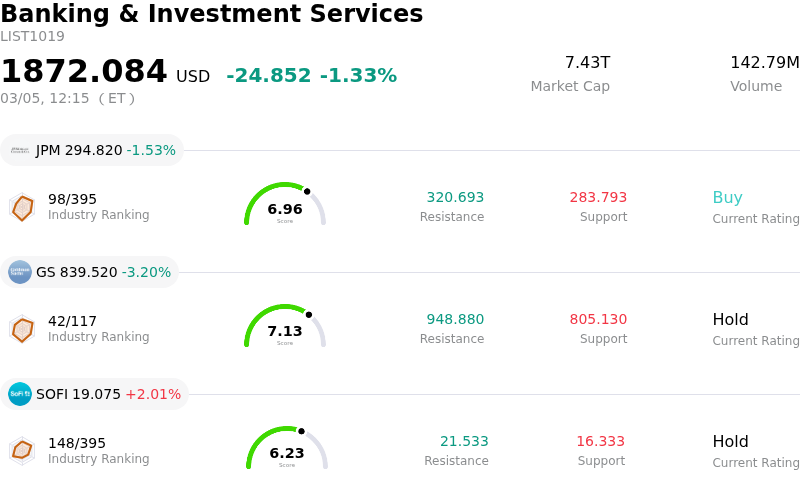
Goldman Sachs Group Inc (GS) moved down by 3.20%. The Banking & Investment Services sector is down by 1.33%. The company underperformed the industry. Top 3 stocks by trading volume in the sector: JPMorgan Chase & Co (JPM) down 1.53%; Goldman Sachs Group Inc (GS) down 3.20%; SoFi Technologies Inc (SOFI) up 2.01%.
What is driving Goldman Sachs Group Inc (GS)’s stock price down today?
Goldman Sachs experienced notable intraday volatility and a decline, primarily influenced by a combination of company-specific risk factors and broader macroeconomic and geopolitical concerns. Analyst sentiment, while generally maintaining a "Hold" consensus for GS, highlights critical risks to the firm's earnings, including a potential decline in equity markets and a slowdown in capital markets activity. There are also indications of ongoing pressure on pre-tax margins and concerns regarding private credit risks and regulatory scrutiny, which investors are actively weighing. This comes after the stock had already seen a softer performance year-to-date and a recent one-month share price return decline.
Adding to these company-specific considerations, escalating geopolitical tensions in West Asia, particularly concerning the Strait of Hormuz, are contributing to market unease. Reports from Goldman Sachs itself on March 5, 2026, warned of potential oil and gas shortages due to disruptions in this strategic waterway, which could impact global energy supply chains. Such developments raise concerns about higher energy prices, potential inflation, and broader economic instability, which typically lead to increased market volatility and a risk-off sentiment that can negatively affect financial institutions like Goldman Sachs. While some financial market updates noted general bullish sentiment in major indices, the specific challenges facing the financial sector and the broader macroeconomic risks appear to be driving the negative price action for Goldman Sachs.
Technical Analysis of Goldman Sachs Group Inc (GS)
Technically, Goldman Sachs Group Inc (GS) shows a MACD (12,26,9) value of [-6.94], indicating a sell signal. The RSI at 40.20 suggests neutral condition and the Williams %R at -70.36 suggests oversold condition. Please monitor closely.
Fundamental Analysis of Goldman Sachs Group Inc (GS)
Goldman Sachs Group Inc (GS) is in the Banking & Investment Services industry. Its latest annual revenue is $117.10B, ranking 2 in the industry. The net profit is $16.30B, ranking 1 in the industry. Company Profile
Over the past month, multiple analysts have rated the company as Hold, with an average price target of $962.28, a high of $1125.00, and a low of $614.29.
More details about Goldman Sachs Group Inc (GS)
Company Specific Risks:
- Legal and Reputational Exposure: The firm faces potential legal and reputational damage due to its departing chief legal officer, Kathryn Ruemmler, being scheduled to testify before the U.S. House Oversight Committee regarding her past ties to Jeffrey Epstein.
- Private Credit Portfolio Scrutiny: Goldman Sachs BDC is experiencing enhanced investor scrutiny concerning its unrated private credit loans, indicating potential underlying transparency and valuation risks within its alternative asset management segment.
- Vulnerability to Geopolitical Market Volatility: Goldman Sachs' own assessments indicate fragile market sentiment and a potential for broader market digestion of Middle East conflicts and commodity price fluctuations, which could adversely affect the firm's trading and investment banking revenues.
This article may include AI-generated content that is human-reviewed, which is for reference and general information purposes only and does not constitute investment advice.
Recommended Articles








Comments (0)
Click the $ button, enter the symbol, and select to link a stock, ETF, or other ticker.