


Texas Instruments Inc Stock (TXN) Moved Down by 5.00% on Nov 13: What Signal Does It Send?


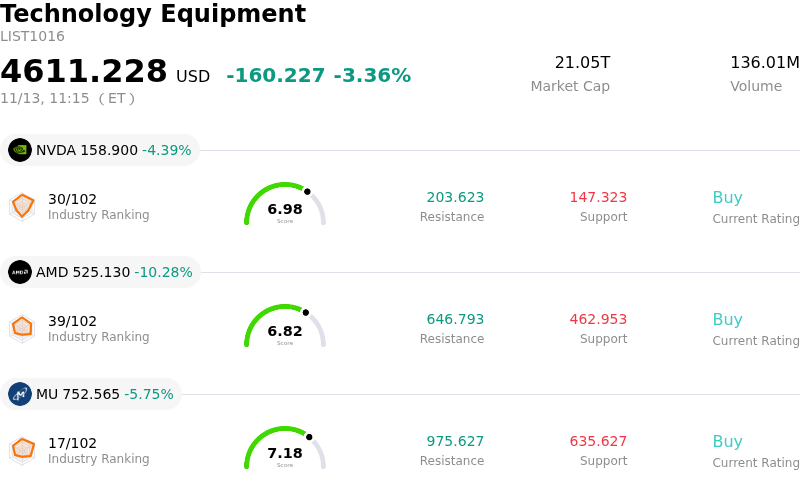
Texas Instruments Inc (TXN) moved down by 5.00%. The Technology Equipment sector is down by 3.36%. The company underperformed the industry. Top 3 stocks by turnover in the sector: NVIDIA Corp (NVDA) down 4.33%; Advanced Micro Devices Inc (AMD) down 10.27%; Micron Technology Inc (MU) down 5.70%.
What is driving Texas Instruments Inc (TXN)’s stock price down today?
Texas Instruments experienced notable downward pressure during the trading session, primarily driven by persistent demand headwinds across its core end markets and cautious sentiment surrounding the broader analog semiconductor sector. As an industry bellwether with heavy exposure to industrial and automotive applications, the company remains particularly sensitive to order adjustments and prolonged inventory digestion among enterprise customers. Recent channel checks and broader market readouts indicate that recovery cycles in industrial manufacturing and automotive electronics are progressing more slowly than previously anticipated, prompting institutional investors to recalibrate their revenue expectations.
Operational and margin dynamics further compound this pressure. Texas Instruments has maintained an aggressive, multi-year internal manufacturing strategy focused on expanding 300-millimeter wafer capacity. While this capital expenditure strategy is designed to deliver structural, long-term cost advantages, it introduces near-term gross margin headwinds through elevated depreciation expenses and lower fab utilization rates during cyclical lulls. When top-line momentum softens, these fixed overhead costs weigh more heavily on operating profitability, leading Wall Street analysts to trim forward earnings estimates and target multiples.
Broader macroeconomic crosscurrents and institutional portfolio shifts are also playing a decisive role. Persistent uncertainty regarding global industrial production, coupled with restrictive financial conditions, has dampened customer appetite for broad-based restocking. Concurrently, institutional capital flows within the semiconductor space continue to display selective dispersion, favoring high-growth artificial intelligence infrastructure over diversified analog suppliers facing extended destocking. Against this backdrop of heightened risk aversion and cyclical uncertainty, Texas Instruments saw amplified selling pressure as market participants reduced exposure to cyclical chipmakers.
Technical Analysis of Texas Instruments Inc (TXN)
Technically, Texas Instruments Inc (TXN) shows a MACD (12,26,9) value of -0.367, indicating a neutral signal. The RSI at 51.469 suggests neutral condition and the Williams %R at 45.290 suggests neutral condition. Please monitor closely.
Fundamental Analysis of Texas Instruments Inc (TXN)
Texas Instruments Inc (TXN) is in the Technology Equipment industry. Its latest annual revenue is $17.68B, ranking 14 in the industry. The net profit is $4.97B, ranking 9 in the industry. Company Profile
Over the past month, multiple analysts have rated the company as Buy, with an average price target of $325.89, a high of $400.00, and a low of $188.00.
More details about Texas Instruments Inc (TXN)
Company Specific Risks:
- Extreme Valuation Multiple Contraction: Texas Instruments trades at an elevated price-to-earnings multiple exceeding 40x, significantly above its historical five-year average of 27x, prompting institutional profit-taking and heavy defensive put positioning that amplifies intraday downside swings.
- Capital Expenditure Burden on Free Cash Flow: Continued aggressive capital spending on 300mm wafer fab expansion programs exerts structural pressure on free cash flow generation, elevating operational risk if cyclical analog chip demand decelerates before new manufacturing capacity yields projected cost efficiencies.
- Pricing Strategy and Gross Margin Vulnerability: Institutional analysts are actively scrutinizing the sustainability of TXN's forward pricing strategy into 2027, citing risks that intensifying competitive dynamics in power management and general-purpose analog components could cap gross margin upside.
- Uneven End-Market Cyclical Recovery: Despite strength in AI data center power demand, broad exposure to persistently flat personal electronics sales and uneven recovery trajectories across industrial and automotive end-markets threatens consensus revenue expectations that are fully priced into the stock.
This article may include AI-generated content that is human-reviewed, which is for reference and general information purposes only and does not constitute investment advice.
Recommended Articles








Comments (0)
Click the $ button, enter the symbol, and select to link a stock, ETF, or other ticker.