


BNB (BNBUSD) Suddenly Goes up 1.32% on Oct 31: What You Need to Watch


BNB (BNBUSD) is up 1.32% at Oct 31 21:10(ET), now at $706.4, with a 7-day down of 3.35%.
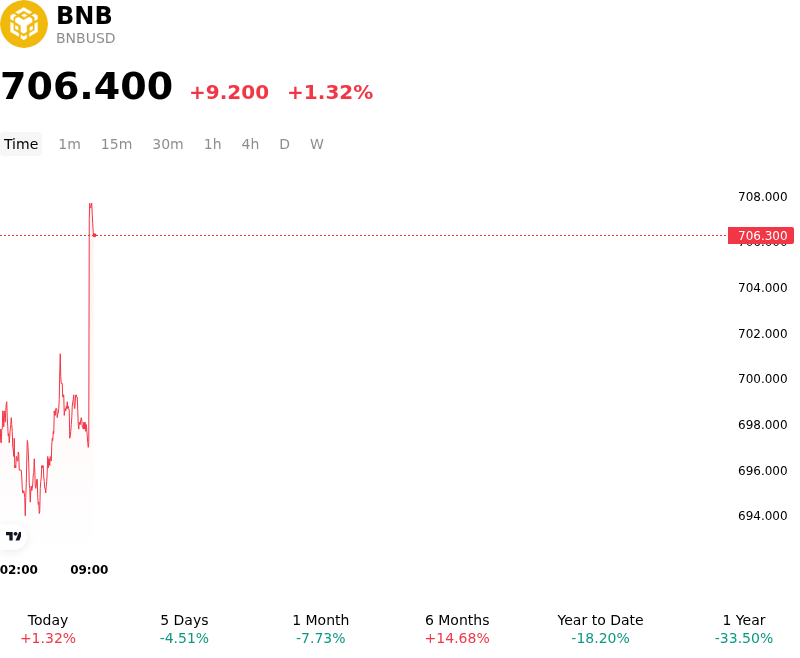
What is driving BNB (BNBUSD)’s stock price up today?
The positive price movement in BNB reflected a stabilization in market sentiment and a relief rally following acute volatility in the prior session. Initial risk aversion stemming from exchange-related security concerns began to subside as immediate risk-mitigation measures were implemented. The confirmation that potential losses would be fully absorbed by exchange security reserves, combined with swift actions by stablecoin issuers and security partners to freeze compromised assets, helped restore market confidence regarding exchange solvency and asset safety. This emergency response halted speculative panic selling, prompting short covering in derivatives markets and attracting dip-buying spot capital.
Beyond short-term sentiment recovery, underlying fundamental momentum within the BNB Chain network provided structural support for the asset. Recent network metrics demonstrate robust ecosystem expansion, highlighted by a substantial increase in quarterly smart contract deployments and growing adoption of on-chain AI agent tools and decentralized applications. Furthermore, institutional engagement through dedicated corporate treasury vehicles and validator operations has broadened institutional access and reinforced long-term adoption thesis, helping absorb spot selling pressure during market drawdowns.
From a macroeconomic perspective, digital assets continue to operate within a complex liquidity landscape defined by Federal Reserve policy signals and volatile Treasury yields. While elevated real interest rates continue to constrain overall liquidity and cap aggressive risk-taking across broader crypto markets, asset-specific developments and ecosystem resilience allowed BNB to outperform during the trading session. Institutional market participants continue to monitor exchange security updates, proof-of-reserves audits, and derivatives positioning to evaluate whether the recent advance signifies a durable structural uptrend or a tactical rebound within a wider consolidation phase.
Technical Analysis of BNB (BNBUSD)
Technically, BNB (BNBUSD) shows a MACD (12,26,9) value of -6.155, indicating a sell signal. The RSI at 41.691 suggests neutral condition and the Williams %R at 64.720 suggests sell condition. Please monitor closely.
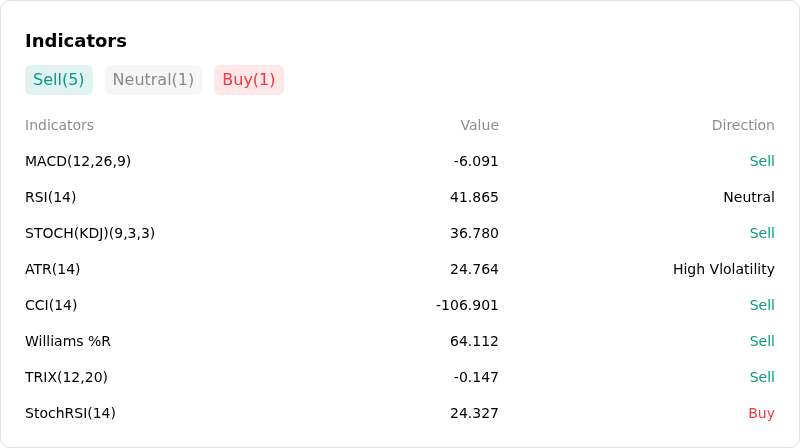
More details about BNB (BNBUSD)
Recent Events and Risks:
- Exchange Security Breach and Operational Friction: Severe downside pressure stems from a major security incident at Binance estimated at $6.3 billion, which forced the exchange to temporarily freeze assets and suspend deposits and withdrawals. Because BNB functions as a direct valuation proxy for Binance's operational health and exchange confidence, traders have aggressively trimmed venue-linked holdings to hedge against counterparty and liquidity risks.
- Derivatives Liquidation Squeeze: Rapid price drops ignited over $1.5 billion in market-wide forced crypto liquidations, with long positions making up over 80% of wiped trades and Binance accounting for nearly half of total liquidation volume. This automated unwinding of leveraged positions has generated cascading sell orders, suppressing spot order book demand and amplifying downward volatility for BNB.
- Heightened Regulatory and Law Enforcement Scrutiny: The security incident has drawn immediate scrutiny from global regulatory authorities and law enforcement agencies, including investigations involving the U.S. Secret Service, FBI, and CFTC. Renewed regulatory friction and international operational oversight risks threaten to restrict institutional capital inflows and sustain an extended risk-off discount on venue-linked assets.
- Weakening On-Chain Activity and Technical Breakdown: On-chain analytics indicate a 14% drop in BNB Chain active daily addresses alongside ongoing wallet asset transfers through privacy mixer protocols. Technically, BNB's breach below critical moving averages and key support around $700 leaves the token vulnerable to automated stop-loss cascades and deeper technical corrections toward $680.
This article may include AI-generated content that is human-reviewed, which is for reference and general information purposes only and does not constitute investment advice.
Recommended Articles










Comments (0)
Click the $ button, enter the symbol, and select to link a stock, ETF, or other ticker.