


Solana (SOLUSD) Is up 1.77% on Oct 31: What Do On-Chain Data and Market Sentiment Show?


Solana (SOLUSD) is up 1.77% at Oct 31 21:05(ET), now at $95.93, with a 7-day down of 4.62%.
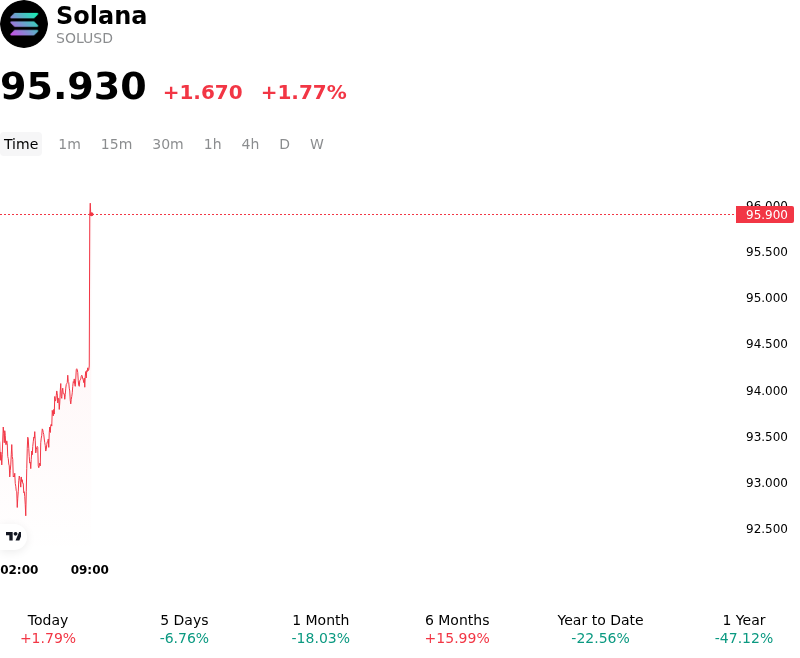
What is driving Solana (SOLUSD)’s stock price up today?
Solana advanced as defensive buying around key technical support levels triggered a firm relief rebound, supported by stabilizing risk sentiment across high-beta digital assets. Improved capital flows into major cryptocurrencies provided a favorable backdrop, prompting traders and systematic strategies to cover short positions near established demand zones. This intraday repricing offset recent pressure from exchange-traded product redemptions, allowing spot liquidity to stabilize and absorb selling overhang.
Capital inflows were further encouraged by steady progress in Solana's institutional ecosystem and on-chain metrics. The network continues to expand its footprint in enterprise financial applications, supported by growing tokenized asset deployments, expanding stablecoin holder adoption, and partnerships across traditional payment processors. Furthermore, recent protocol enhancements, including the Alpenglow consensus upgrade aimed at significantly reducing transaction finality times, continue to solidify Solana's competitive positioning regarding network speed and transaction efficiency among alternative Layer-1 platforms.
In the derivatives market, a stabilization in open interest and a normalization of perpetual futures funding rates indicated that downside leverage pressure had abated, paving the way for spot-driven accumulation. Although institutional investors continue to monitor daily ETF flow trends and broader macro liquidity conditions, the underlying expansion of real-world asset tokenization and network throughput serves as a fundamental catalyst supporting medium-term sentiment. Key risks monitored by market participants remain focused on altcoin liquidity conditions, regulatory developments, and broader monetary policy shifts.
Technical Analysis of Solana (SOLUSD)
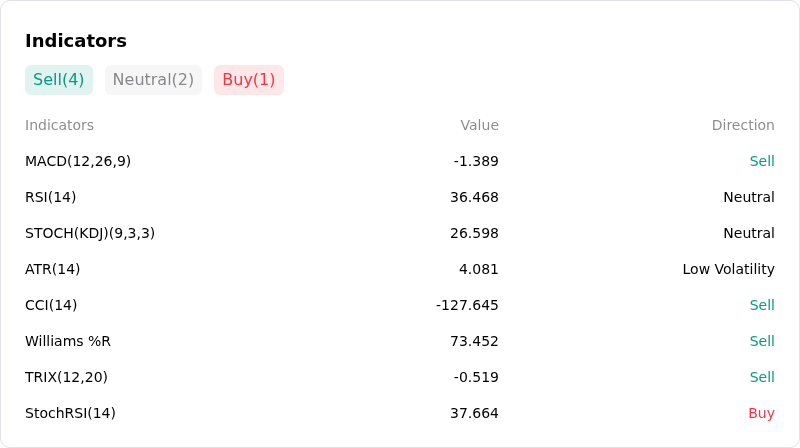
Technically, Solana (SOLUSD) shows a MACD (12,26,9) value of -1.389, indicating a sell signal. The RSI at 36.468 suggests neutral condition and the Williams %R at 73.452 suggests sell condition. Please monitor closely.
More details about Solana (SOLUSD)
Recent Events and Risks:
- Institutional Spot ETF Outflows: Spot Solana exchange-traded funds in the U.S. recorded $24.8 million in net withdrawals over recent sessions, marking the largest single-day capital outflow since late 2025 and weakening institutional buy-side support.
- Large Whale On-Chain Selling: On-chain transaction data revealed a major wallet holder liquidated over 1.02 million SOL (valued at roughly $104.3 million) across a five-day window, creating severe spot supply overhang and thinning order book depth.
- Derivatives Leverage Cascade and Long Liquidations: Over $23 million in leveraged long perpetual futures were forcibly liquidated as SOL broke key support, creating automated sell cascades across major trading venues during broader market volatility.
- Technical Support Breach and Macro Headwinds: SOL slid below its 20-day and 50-day moving averages and broke under the psychological $100 support level, underperforming amid rising Treasury yields and cross-market risk aversion.
This article may include AI-generated content that is human-reviewed, which is for reference and general information purposes only and does not constitute investment advice.
Recommended Articles










Comments (0)
Click the $ button, enter the symbol, and select to link a stock, ETF, or other ticker.