


Bitcoin (BTCUSD) Is down 2.43% on Oct 31: What Do On-Chain Data and Market Sentiment Show?


Bitcoin (BTCUSD) is down 2.43% at Oct 31 20:05(ET), now at $76908.01, with a 7-day down of 4.45%.
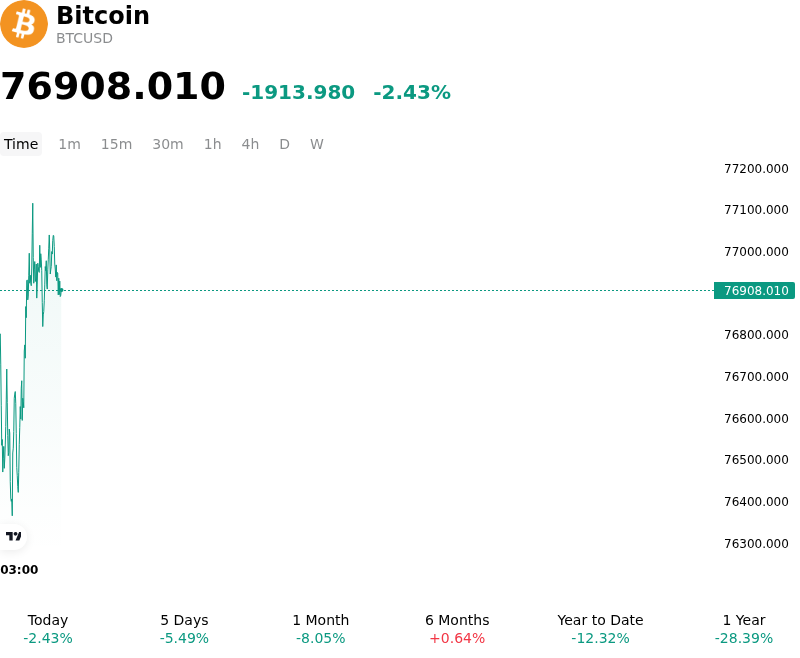
What is driving Bitcoin (BTCUSD)’s stock price down today?
The recent retreat in Bitcoin reflects a broader risk-off repricing across global financial markets, driven by a convergence of exchange-related security concerns, tech-sector equity weakness, and tightening spot liquidity. Headline anxiety surrounding a significant security breach at a major centralized exchange unnerved market participants, prompting immediate risk reduction across digital asset portfolios. This platform shock coincided with broader volatility in risk assets, as disappointing technology earnings weighed heavily on benchmark equity indexes. The resulting contraction in market liquidity pressured high-beta assets, leading institutional desks to temporarily scale back directional exposure.
Institutional capital flows through spot Bitcoin exchange-traded funds displayed marked caution, shifting toward net outflows and diminished primary creation activity. As institutional allocators reassessed short-term risk parameters, the deceleration in ETF buying weakened the structural bid that had reliably supported market dips in preceding sessions. At the same time, macroeconomic headwinds added pressure, with persistent Federal Reserve interest rate uncertainty and elevated U.S. Treasury yields increasing the opportunity cost of holding non-yielding digital assets, favoring cash preservation over speculative risk-taking.
Derivatives positioning further amplified the downward trajectory, as leveraged long contracts faced aggressive liquidations across major crypto derivatives venues. As spot valuations broke through intraday technical support levels, forced margin calls triggered automated selling cascades, exacerbating order book imbalance and expanding intraday volatility. On-chain data indicated a transient rise in exchange-bound token transfers from short-term holders seeking liquidity, while long-term institutional custodians maintained steady balance positions. Near-term market recovery remains contingent on the stabilization of platform confidence, the absorption of remaining derivative leverage, and a clearer macroeconomic policy framework.
Technical Analysis of Bitcoin (BTCUSD)
Technically, Bitcoin (BTCUSD) shows a MACD (12,26,9) value of -971.300, indicating a sell signal. The RSI at 33.810 suggests neutral condition and the Williams %R at 92.860 suggests oversold condition. Please monitor closely.
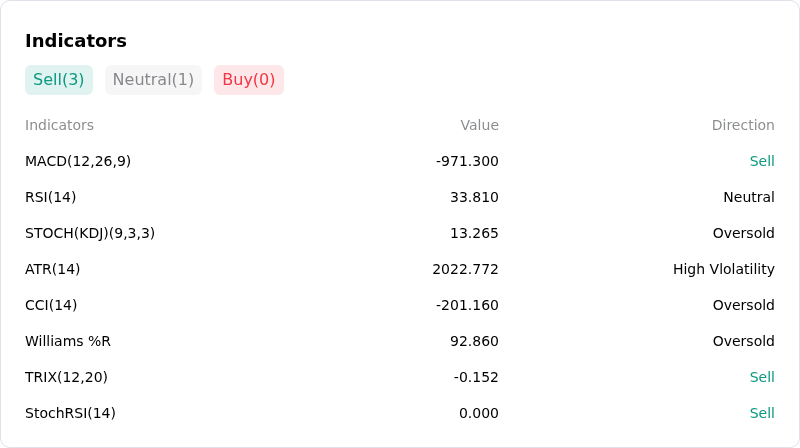
More details about Bitcoin (BTCUSD)
Recent Events and Risks:
- Institutional Spot ETF Outflows: Heavy net daily withdrawals from U.S. spot Bitcoin ETFs—including a sharp $635.6 million single-day redemption led by major funds like IBIT and FBTC—underscore weakening institutional conviction and sustained spot market selling pressure.
- Derivatives Leverage and Long Liquidation Cascades: Rising futures open interest paired with forced long liquidations near the critical $79,000–$80,000 support zone creates structural risk for self-reinforcing liquidation waves if key technical levels fail.
- Macro Headwinds and Fed Policy Uncertainty: Persistent inflation concerns, rising geopolitical tension, and risk-off sentiment across technology equities ahead of Federal Reserve monetary policy decisions continue to weigh heavily on digital asset risk appetite.
- Depressed Spot Demand Metrics: Negative 30-day apparent spot demand indicators and lack of sustained spot accumulation reveal weak buyer absorption, leaving the market highly vulnerable to further intraday downward volatility.
This article may include AI-generated content that is human-reviewed, which is for reference and general information purposes only and does not constitute investment advice.
Recommended Articles










Comments (0)
Click the $ button, enter the symbol, and select to link a stock, ETF, or other ticker.