


Amphenol Corp Stock (APH) Moved Down by 4.39% on Oct 30: Facts Behind the Movement


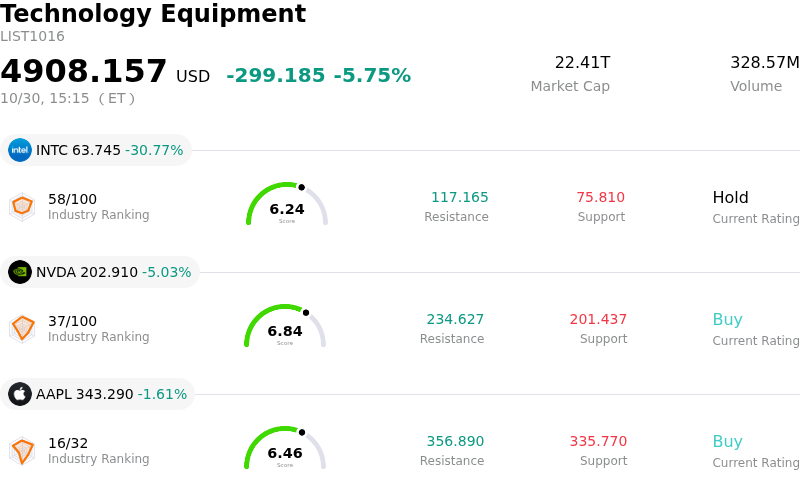
Amphenol Corp (APH) moved down by 4.39%. The Technology Equipment sector is down by 5.75%. The company outperformed the industry. Top 3 stocks by turnover in the sector: Intel Corp (INTC) down 30.63%; NVIDIA Corp (NVDA) down 4.86%; Apple Inc (AAPL) down 1.60%.
What is driving Amphenol Corp (APH)’s stock price down today?
Amphenol Corporation experienced notable downward volatility during the trading session, driven primarily by profit-taking following a multi-day rally. The pull-back occurred despite the company delivering record third-quarter financial results that surpassed consensus expectations on both revenue and earnings. Fueled by strong demand for artificial intelligence infrastructure, data communications connectivity, and integration synergies from its CommScope acquisition, the company had also raised its full-year guidance, alongside announcing a share buyback program and dividend increase. However, after the initial post-earnings surge propelled the equity to near multi-week highs, short-term traders moved to lock in gains, applying immediate selling pressure.
From a technical standpoint, momentum indicators entering overbought territory triggered automated selling as the stock retreated toward underlying support levels. Investors also scrutinized valuation metrics, given that Amphenol trades at a premium forward earnings multiple compared to sector peers. Although overall fundamentals remain strong with a book-to-bill ratio well above unity and a growing backlog, market participants focused on sequential operating margin trends. With second-quarter results having benefited from notable tariff recoveries, the moderation in sequential margin expansion led some institutional investors to re-examine near-term upside expectations.
Broader market dynamics and price target recalibrations from several brokerages following a recent stock split and post-earnings updates contributed to intraday volatility. Additionally, broader macro concerns surrounding corporate capital expenditure pace in the technology supply chain induced caution across the sector. Nevertheless, institutional sentiment around Amphenol remains largely constructive, backed by robust free cash flow generation and leadership in high-speed connectivity. Today's retreat is widely viewed as tactical profit-taking and price digestion following a strong earnings-driven run rather than a shift in long-term operational performance.
Technical Analysis of Amphenol Corp (APH)
Technically, Amphenol Corp (APH) shows a MACD (12,26,9) value of -0.293, indicating a sell signal. The RSI at 45.331 suggests neutral condition and the Williams %R at 51.940 suggests neutral condition. Please monitor closely.
Media Coverage of Amphenol Corp (APH)
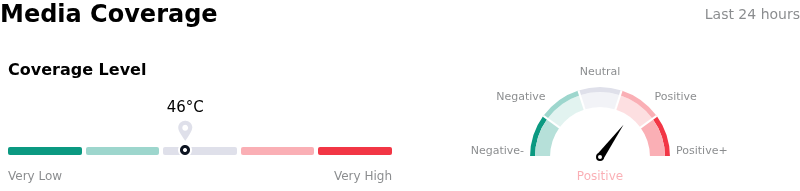
In terms of media coverage, Amphenol Corp (APH) shows a coverage score of 46, indicating a moderate level of media attention. The overall market sentiment index is currently in bullish zone.
Fundamental Analysis of Amphenol Corp (APH)
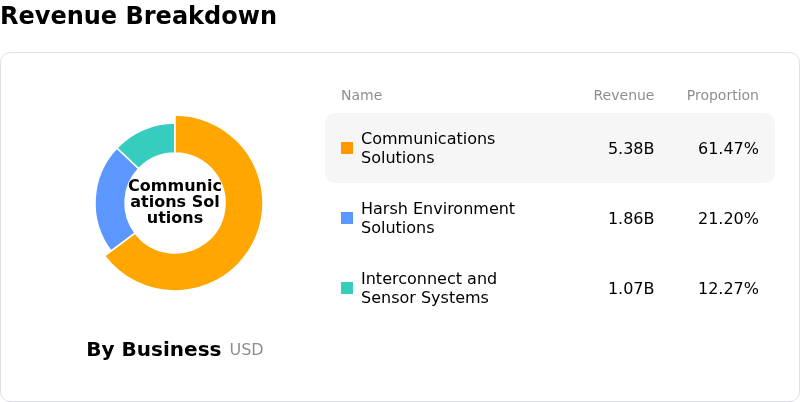
Amphenol Corp (APH) is in the Technology Equipment industry. Its latest annual revenue is $23.09B, ranking 4 in the industry. The net profit is $4.27B, ranking 1 in the industry. Company Profile
Over the past month, multiple analysts have rated the company as Buy, with an average price target of $104.67, a high of $122.00, and a low of $85.00.
More details about Amphenol Corp (APH)
Company Specific Risks:
- Post-Earnings Profit-Taking and Elevated Valuation: Following a post-earnings rally, intraday downward pressure intensified as market participants locked in profits, demonstrating the stock's vulnerability to pullbacks given its high relative valuation.
- Sequential Growth Deceleration and Margin Dilution: Fourth-quarter 2026 guidance points to slowing sequential top-line momentum relative to third-quarter performance, while operating margins face potential compression from acquisition dilution and diminishing tariff recovery benefits.
- Substantial Debt Load and Integration Obligations: Recent filings show long-term debt rising to $17.17 billion against $5.3 billion in cash equivalents, escalating interest expense burdens and execution risks associated with integrating large-scale acquisitions like CommScope.
- AI Hardware Rotation and Sub-Segment Softness: Intraday volatility was exacerbated by tactical sector rotations away from traditional copper connectors toward optical interconnects, combined with ongoing demand weakness across non-AI enterprise networking segments.
This article may include AI-generated content that is human-reviewed, which is for reference and general information purposes only and does not constitute investment advice.
Recommended Articles









Comments (0)
Click the $ button, enter the symbol, and select to link a stock, ETF, or other ticker.