


General Electric Co Stock (GE) Moved Down by 3.04% on Oct 30: What Signal Does It Send?


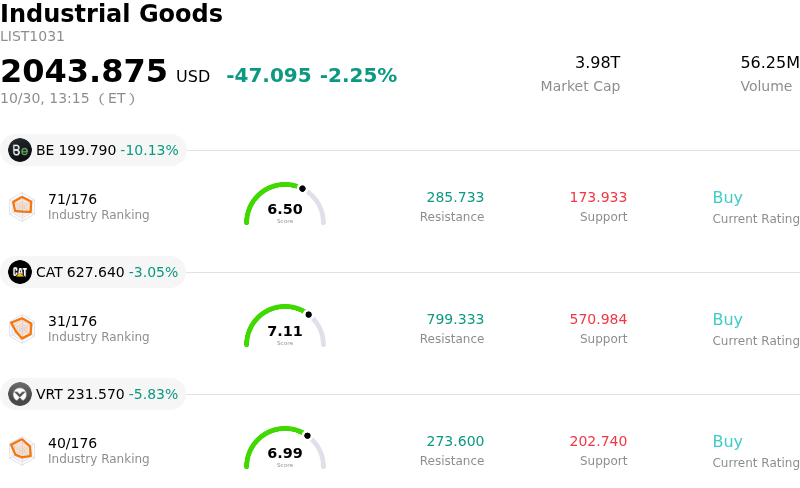
General Electric Co (GE) moved down by 3.04%. The Industrial Goods sector is down by 2.25%. The company underperformed the industry. Top 3 stocks by turnover in the sector: Bloom Energy Corp (BE) down 10.13%; Caterpillar Inc (CAT) down 3.05%; Vertiv Holdings Co (VRT) down 5.83%.
What is driving General Electric Co (GE)’s stock price down today?
General Electric, trading as GE Aerospace, experienced downside pressure and notable intraday volatility as market participants continued to digest the company's third-quarter financial results alongside broader aerospace sector headwinds. While the company recently reported revenue and earnings per share that exceeded Wall Street estimates and prompted management to raise its full-year outlook across profit and revenue metrics, investors remain focused on underlying operational friction. A primary factor behind the market's cautious stance is the year-over-year contraction in quarterly free cash flow, coupled with slight margin compression in the commercial engines and services division driven by higher product durability reserves, elevated sales allowances, and persistent cost inflation.
Beyond earnings mechanics, broader industry dynamics continue to weigh on market sentiment. Supply chain bottlenecks across the aerospace sector persist, limiting engine delivery fulfillment and raising concerns over output speed. Concurrently, elevated jet fuel prices and geopolitical uncertainties have prompted some commercial airlines to consider trimming flight schedules. Because GE Aerospace derives a significant share of high-margin revenue from aftermarket services tied to total flight departures, any potential slowdown in commercial flight activity directly influences forward growth expectations. Additionally, non-core insurance operations swung to a pretax loss, creating further noise around short-term earnings quality.
From a market strategy perspective, the stock's elevated valuation multiple relative to intermediate cash flow growth leaves limited buffer for operational disruptions or macro pullbacks. Recent analyst price target adjustments and profit-taking by short-term traders following earnings-related swings have intensified price volatility. Although robust commercial backlog expansion and solid defense order growth provide strong structural tailwinds, institutional investors are carefully evaluating how effectively management can navigate persistent supply constraints, defend operating margins against inflation, and finalize key engine certifications in the coming quarters.
Technical Analysis of General Electric Co (GE)
Technically, General Electric Co (GE) shows a MACD (12,26,9) value of 2.802, indicating a neutral signal. The RSI at 46.986 suggests neutral condition and the Williams %R at 41.519 suggests buy condition. Please monitor closely.
Media Coverage of General Electric Co (GE)
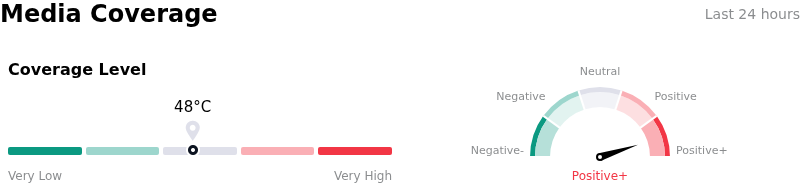
In terms of media coverage, General Electric Co (GE) shows a coverage score of 48, indicating a moderate level of media attention. The overall market sentiment index is currently in extremely bullish zone.
Fundamental Analysis of General Electric Co (GE)
General Electric Co (GE) is in the Industrial Goods industry. Its latest annual revenue is $45.85B, ranking 5 in the industry. The net profit is $8.70B, ranking 1 in the industry. Company Profile
Over the past month, multiple analysts have rated the company as Buy, with an average price target of $378.87, a high of $435.00, and a low of $280.00.
More details about General Electric Co (GE)
Company Specific Risks:
- Free Cash Flow and Working Capital Compression: GE Aerospace reported a 14% year-over-year decline in quarterly free cash flow to $2.0 billion alongside a $1.8 billion nine-month working capital drain, fueled by a $2.35 billion surge in receivables and increased inventory levels.
- Cost Inflation and Operating Margin Compression: Cost of sales jumped 17.2% year-over-year to $9.1 billion, compressing operating margins by 80 basis points to 19.9% as persistent supply chain bottlenecks, product durability reserves, and $1.56 billion in sales allowances/concessions eroded profitability.
- Softer Q4 Outlook and Boeing 777X Ramp Costs: Management's implied fourth-quarter earnings guidance of $1.87 to $1.97 per share fell well short of Wall Street's $2.04 expectation, while management highlighted a projected $300 million profit headwind in 2027 tied to scaling GE9X engine production for Boeing's delayed 777X program.
- Elevated Valuation and Institutional Target Downgrades: Trading at an elevated forward price-to-earnings ratio of over 33x, GE Aerospace faces price target reductions and underperform ratings from Wall Street research firms, leaving zero margin of safety against operational delays or supply disruption.
This article may include AI-generated content that is human-reviewed, which is for reference and general information purposes only and does not constitute investment advice.
Recommended Articles









Comments (0)
Click the $ button, enter the symbol, and select to link a stock, ETF, or other ticker.