


Gilead Sciences Inc Stock (GILD) Moved Up by 3.83% on Oct 30: What Investors Need To Know


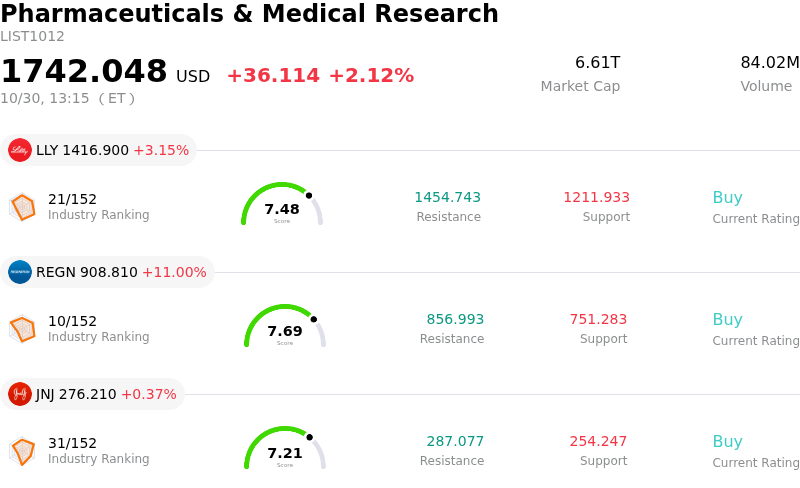
Gilead Sciences Inc (GILD) moved up by 3.83%. The Pharmaceuticals & Medical Research sector is up by 2.12%. The company outperformed the industry. Top 3 stocks by turnover in the sector: Eli Lilly and Co (LLY) up 3.15%; Regeneron Pharmaceuticals Inc (REGN) up 11.00%; Johnson & Johnson (JNJ) up 0.28%.
What is driving Gilead Sciences Inc (GILD)’s stock price up today?
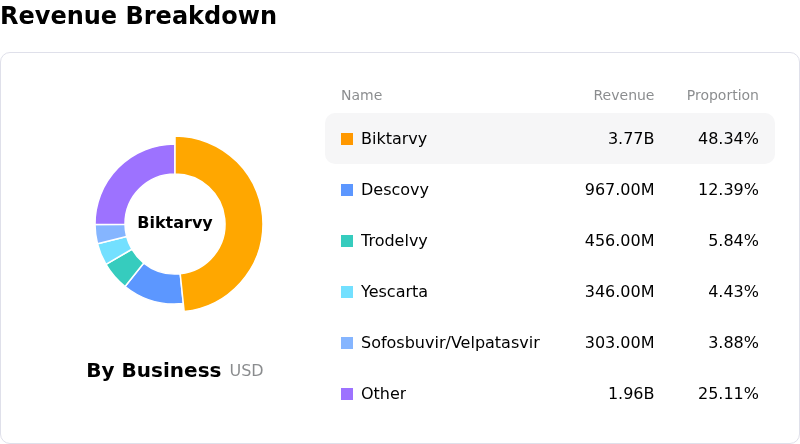
Gilead Sciences experienced notable upward momentum, driven primarily by robust third-quarter 2026 financial results that surpassed Wall Street consensus expectations across both top and bottom lines. The biopharmaceutical leader posted non-GAAP diluted earnings per share of $2.55, handily topping analyst forecasts, while total revenue rose to $8.30 billion, reflecting a strong year-over-year expansion. The outperformance was anchored by exceptional strength in Gilead's core HIV franchise, where quarterly sales expanded 18% year-over-year, propelled by record market share for Biktarvy and accelerating demand for HIV prevention therapies such as Descovy. Additionally, robust demand across the oncology and liver disease portfolios provided further top-line momentum, helping offset declines in COVID-19 treatment sales.
Beyond quarterly execution, investor sentiment was bolstered by management's decision to raise full-year 2026 product sales guidance to a range of $31.0 billion to $31.3 billion, up from the prior range of $30.1 billion to $30.4 billion. Executive leadership characterized the period as delivering the company's strongest base-business growth in over a decade, signaling sustained operational health and commercial execution. Strong quarterly operating cash flow of $5.0 billion further demonstrated financial stability, supporting dividend distributions and strategic investments in research and development. While investors digested news regarding future Medicare price adjustments for key therapies set to take effect in 2028, the company's expanding clinical pipeline across oncology and inflammation reassured market participants regarding long-term growth prospects.
The positive earnings outcome triggered constructive analyst commentary and target price upward revisions across major institutional firms, reinforcing institutional conviction in Gilead's fundamental trajectory. The stock's upward trajectory was particularly notable as it occurred amidst a challenging broader market backdrop, underscoring robust stock-specific buying interest. With durable commercial momentum, consistent cash generation, and an accelerating R&D pipeline, Gilead's operational execution effectively drove positive price action and firmed investor confidence.
Technical Analysis of Gilead Sciences Inc (GILD)
Technically, Gilead Sciences Inc (GILD) shows a MACD (12,26,9) value of 2.892, indicating a buy signal. The RSI at 75.372 suggests buy condition and the Williams %R at 12.306 suggests overbought condition. Please monitor closely.
Fundamental Analysis of Gilead Sciences Inc (GILD)
Gilead Sciences Inc (GILD) is in the Pharmaceuticals & Medical Research industry. Its latest annual revenue is $29.44B, ranking 15 in the industry. The net profit is $8.51B, ranking 8 in the industry. Company Profile
Over the past month, multiple analysts have rated the company as Buy, with an average price target of $160.01, a high of $185.00, and a low of $126.00.
More details about Gilead Sciences Inc (GILD)
Company Specific Risks:
- Medicare Price Controls on Biktarvy: CMS finalized the Maximum Fair Price for flagship HIV drug Biktarvy under Medicare, which management estimates will reduce annual net revenue by $1.5 billion starting in 2028, presenting severe long-term valuation headwinds for the core commercial franchise.
- FY2026 Adjusted EPS Guidance Cut: In its Q3 2026 earnings report on October 29, Gilead lowered its full-year adjusted EPS guidance range to $(1.20)–$(0.85) from $(0.65)–$(0.30), heavily impacted by $12.4 billion ($9.88 per share) in acquired in-process R&D expenses from recent M&A activity.
- Balance Sheet Strain and Equity Erosion: According to Form 10-Q filed October 30, 2026, stockholders' equity shrank sharply to $12.96 billion from $22.62 billion at year-end 2025, while net debt expanded to nearly $19.8 billion following heavy cash usage for acquisitions.
- Segment Revenue Contraction and Inventory Distortion: Q3 2026 operational updates showed Cell Therapy sales fell 18% year-over-year to $355 million due to heightened market competition, Veklury revenue plunged 69% to $86 million, and analysts highlighted that Q3 HIV sales growth was partially distorted by temporary distributor inventory builds.
This article may include AI-generated content that is human-reviewed, which is for reference and general information purposes only and does not constitute investment advice.
Recommended Articles









Comments (0)
Click the $ button, enter the symbol, and select to link a stock, ETF, or other ticker.