


Goldman Sachs Group Inc Stock (GS) Moved Down by 3.64% on Oct 30: Key Drivers Unveiled


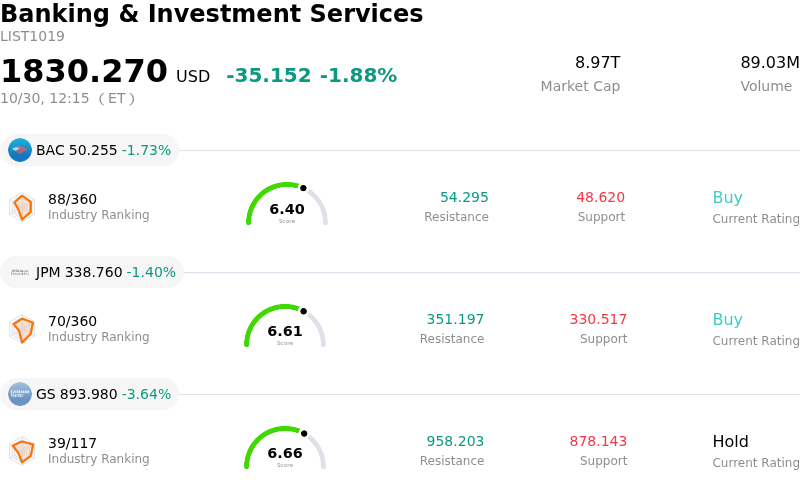
Goldman Sachs Group Inc (GS) moved down by 3.64%. The Banking & Investment Services sector is down by 1.88%. The company underperformed the industry. Top 3 stocks by turnover in the sector: Bank of America Corp (BAC) down 1.73%; JPMorgan Chase & Co (JPM) down 1.44%; Goldman Sachs Group Inc (GS) down 3.64%.
What is driving Goldman Sachs Group Inc (GS)’s stock price down today?
On October 30, 2026, shares of The Goldman Sachs Group experienced downward pressure alongside broader weakness across major U.S. equity benchmarks. Market sentiment across the financial sector deteriorated amid macroeconomic uncertainty, elevated Treasury yields, and broad-based profit taking following recent corporate reporting cycles. As institutional investors reassessed equity exposure, major financial bellwethers faced heightened intraday volatility driven by systemic sector rotation.
While Goldman Sachs delivered strong third-quarter financial results earlier in the month—beating consensus estimates behind solid equities trading and advisory fee performance—market focus has shifted toward sequential revenue normalization and cost headwinds. Revenue in Global Banking & Markets moderated relative to record levels achieved in prior quarters, while operating expenses increased year-over-year due to higher transaction and compensation costs. Furthermore, elevated credit loss provisions and lingering markdowns in consumer loan portfolios have added caution to forward earnings trajectory expectations.
Analyst sentiment and technical factors also influenced the stock's move. Sell-side firms, including RBC Capital Markets, recently adjusted price targets to reflect normalized investment banking pipelines and broader capital market conditions. Meanwhile, technical indicators signaling near-term overbought conditions following previous trading rallies prompted tactical selling from institutional market participants. Despite solid underlying capital ratios and ongoing dividend distributions, short-term price action remains sensitive to broader market volatility and shifting macroeconomic policy expectations.
Technical Analysis of Goldman Sachs Group Inc (GS)
Technically, Goldman Sachs Group Inc (GS) shows a MACD (12,26,9) value of 13.711, indicating a neutral signal. The RSI at 44.843 suggests neutral condition and the Williams %R at 56.505 suggests sell condition. Please monitor closely.
Media Coverage of Goldman Sachs Group Inc (GS)
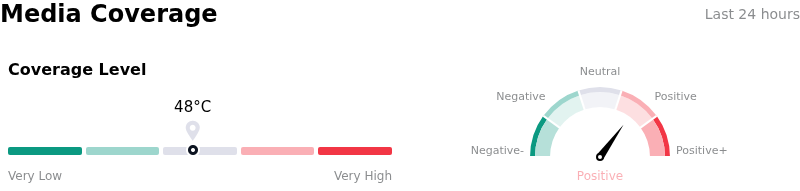
In terms of media coverage, Goldman Sachs Group Inc (GS) shows a coverage score of 48, indicating a moderate level of media attention. The overall market sentiment index is currently in bullish zone.
Fundamental Analysis of Goldman Sachs Group Inc (GS)
Goldman Sachs Group Inc (GS) is in the Banking & Investment Services industry. Its latest annual revenue is $117.10B, ranking 2 in the industry. The net profit is $16.30B, ranking 1 in the industry. Company Profile
Over the past month, multiple analysts have rated the company as Hold, with an average price target of $1045.30, a high of $1250.00, and a low of $875.00.
More details about Goldman Sachs Group Inc (GS)
Company Specific Risks:
- Sequential Trading & Investment Banking Revenue Contraction: Goldman Sachs' Global Banking & Markets division saw net revenues fall 13% quarter-over-quarter from its Q2 peak to $13.46 billion in Q3 2026. This sequential decline underscores the bank's vulnerability to a broader slowdown in fixed-income and equity trading activity following earlier record surges.
- Deteriorating Risk Appetite & Retail Liquidity Pullback: Goldman Sachs' proprietary risk appetite indicator dropped below zero to its lowest level since April, accompanied by a 45% drop in retail trading activity from late 2025 levels and significant hedge fund deleveraging. This broader institutional risk-off rotation into Treasuries threatens trading volume, liquidity, and asset management fee growth.
- Valuation Compression & Share Repurchase Overhang: Following price target reductions by analysts at Citigroup to $1,000, GS shares continue to trade significantly below the $1,048.73 average price per share at which management executed $3 billion in Q3 buybacks. This disparity reflects growing market skepticism regarding capital allocation efficiency in a sustained high-interest-rate environment.
- Legacy Consumer Segment Markdowns & Elevated Credit Losses: The firm's Platform Solutions division registered a 72% year-over-year revenue decline in Q3 due to portfolio markdowns associated with offloading its Apple Card loan business, while provision for credit losses climbed to $368 million. Ongoing operational repositioning in consumer lending continues to impose margins drag on core profits.
This article may include AI-generated content that is human-reviewed, which is for reference and general information purposes only and does not constitute investment advice.
Recommended Articles









Comments (0)
Click the $ button, enter the symbol, and select to link a stock, ETF, or other ticker.