


Ethereum (ETHUSD) Is up 1.51% on Oct 21: What Are the Risk Factors?



Ethereum (ETHUSD) is up 1.51% at Oct 21 09:05(ET), now at $2483.45, with a 7-day up of 2.87%.
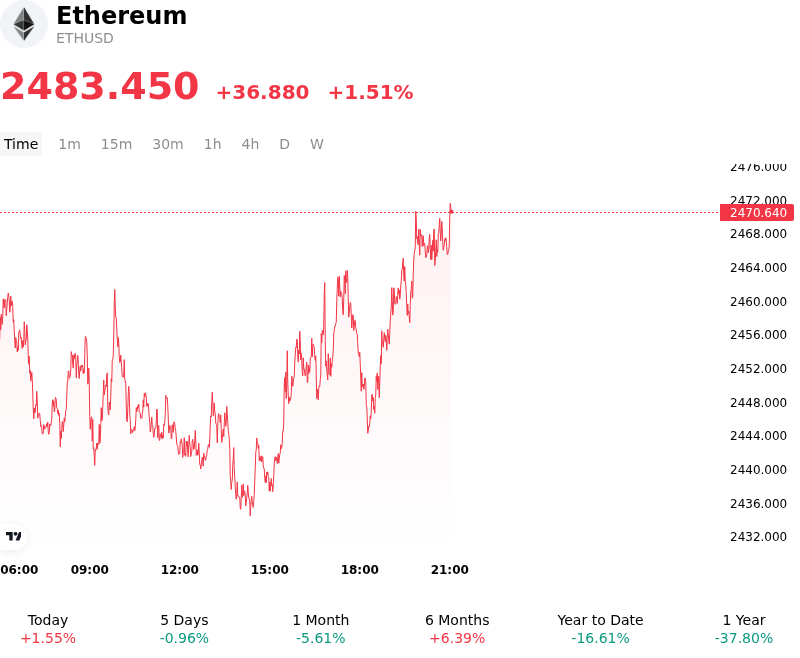
What is driving Ethereum (ETHUSD)’s stock price up today?
Ethereum traded higher as spot market buyers successfully defended critical technical support levels near the demand zone, where key moving averages and the realized on-chain cost basis provided a solid floor. After enduring weeks of persistent selling pressure, a stabilization in leverage positioning triggered a squeeze on overcrowded short positions in the derivatives market, helping drive prices back above key psychological thresholds. The move reflects a localized rebound driven by short covering and spot market defense following a deep correction earlier in the month.
A primary factor easing downside pressure was the initial stabilization in spot Ethereum ETF flows. Following an aggressive stretch of net outflows through early October that erased previous monthly gains, daily redemption activity moderated significantly, with selective net daily inflows returning to institutional products. While overall ETF flows remain cautious, the pause in institutional redemptions alleviated immediate supply overhangs in the spot market and improved short-term liquidity conditions.
Macroeconomic factors and ecosystem catalysts also supported risk sentiment across the digital asset space. As global yields consolidated and crypto derivative volatility settled near cycle lows, market participants turned their focus toward upcoming monetary policy signals. Medium-term fundamental drivers added further resilience, highlighted by ongoing protocol testnet advancements aimed at expanding network capacity and growing corporate treasury engagement.
Despite the positive intraday price action, the movement represents a tactical relief bounce within a broader consolidation phase rather than a full structural trend reversal. Technical resistance near short-term moving averages continues to restrict aggressive upside extensions. Institutional market participants continue to monitor Federal Reserve interest rate expectations, Treasury yield movements, and the consistency of spot ETF capital flows before committing significant long-term capital.
Technical Analysis of Ethereum (ETHUSD)
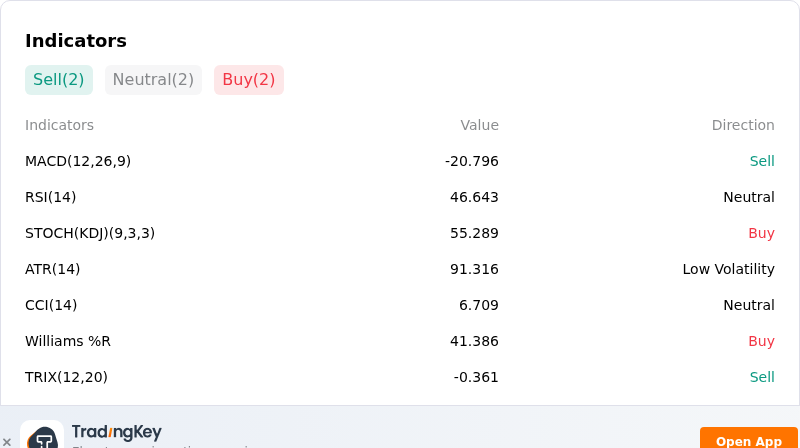
Technically, Ethereum (ETHUSD) shows a MACD (12,26,9) value of -20.796, indicating a sell signal. The RSI at 46.643 suggests neutral condition and the Williams %R at 41.386 suggests buy condition. Please monitor closely.
More details about Ethereum (ETHUSD)
Recent Events and Risks:
- Institutional Capital Flight via Spot ETF Outflows: U.S. spot Ethereum ETFs have suffered sustained net outflows, including $103.3 million withdrawn in a single session led by BlackRock's ETHA, reflecting a sharp decline in institutional demand and maintaining persistent selling pressure on spot markets.
- Leveraged Long Liquidation Cascades Near Key Support Levels: Following significant long wipeouts across derivative venues, open interest maps show up to $801 million in cumulative long leverage vulnerable to forced liquidation if ETH breaks down through the critical $2,279–$2,350 support zone.
- Whale Deposits and Increasing Exchange Reserve Balances: On-chain tracking revealed multiple dormant and large whale addresses transferring over $74.5 million worth of ETH to centralized exchanges such as Kraken and Gemini, elevating immediate sell-side order book supply and market overhang.
- Macro Risk-Off Sentiment Ahead of Federal Reserve Decision: Hotter-than-expected inflation figures and macroeconomic uncertainty leading into the upcoming Federal Reserve policy decision continue to weigh heavily on risk assets, weakening broader crypto market liquidity and appetite.
This article may include AI-generated content that is human-reviewed, which is for reference and general information purposes only and does not constitute investment advice.
Recommended Articles








Comments (0)
Click the $ button, enter the symbol, and select to link a stock, ETF, or other ticker.