


Ethereum (ETHUSD) Suddenly Goes up 1.72% on Oct 2: What You Need to Watch



Ethereum (ETHUSD) is up 1.72% at Oct 2 00:30(ET), now at $2742.61, with a 7-day up of 1.88%.
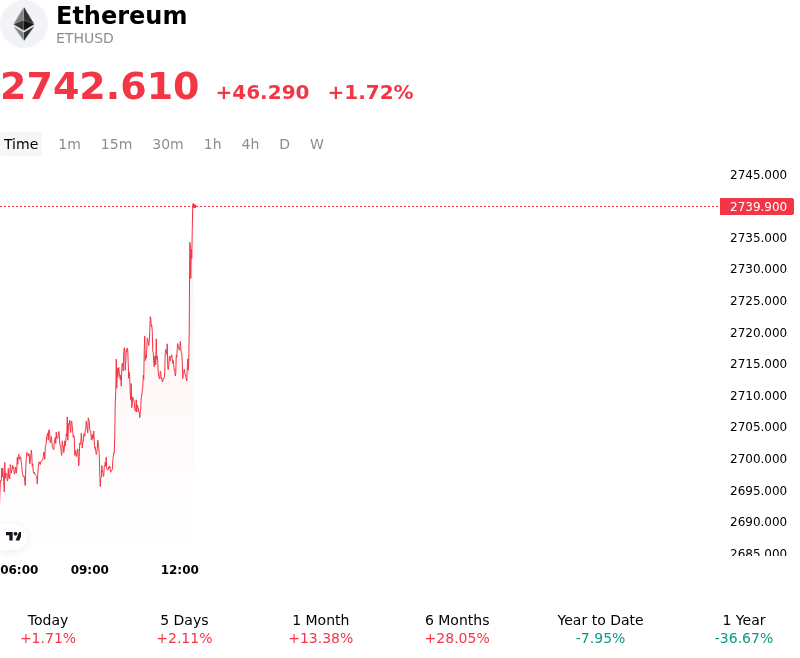
What is driving Ethereum (ETHUSD)’s stock price up today?
Ethereum advanced as positive risk sentiment returned to digital asset markets at the start of the fourth quarter, driven by favorable macroeconomic conditions and renewed institutional capital flows. Market expectations for a potential pause in Federal Reserve policy tightening, alongside stabilizing U.S. Treasury yields, provided a supportive macro backdrop. Cooling bond yields and a softer U.S. dollar eased broader financial conditions, improving global liquidity and encouraging institutional trading desks to re-engage with high-beta smart contract assets following quarter-end portfolio realignments.
Underlying structural support was further reinforced by institutional demand through regulated investment products. Broader allocations into digital asset funds and sustained interest in spot Ethereum exchange-traded funds signaled ongoing institutional accumulation following a strong third quarter. Regulated ETF inflows provided a persistent source of spot market absorption, building a firm floor under price action and absorbing circulating market liquidity [1.4.4].
Network-specific fundamentals and supply-side dynamics continued to bolster investor confidence. Expansion across Layer-2 scaling solutions, coupled with resilient total value locked across decentralized finance protocols, underscored steady network usage and transactional demand. Simultaneously, high staking participation rates locked a significant portion of circulating supply into proof-of-stake contracts. This reduction in liquid exchange balances effectively tightened available spot order book depth, magnifying the impact of incremental capital inflows on price discovery.
In the derivatives market, short-covering activity and normalized leverage conditions accelerated the upward momentum. A squeeze on speculative short positions on perpetual futures exchanges, triggered as prices breached key overhead resistance levels, forced bearish position liquidations and added short-term buying pressure. While investors remain attentive to upcoming economic indicators and shifting central bank rate trajectories, Ethereum's market structure remains supported by institutional adoption, active network utilization, and supply constraints.
Technical Analysis of Ethereum (ETHUSD)
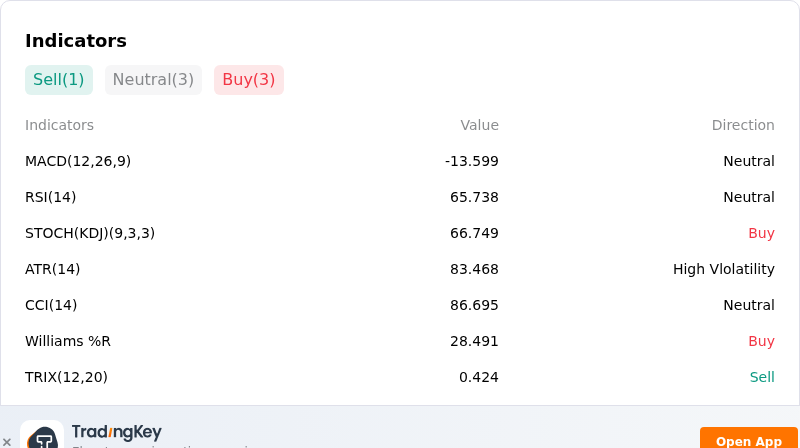
Technically, Ethereum (ETHUSD) shows a MACD (12,26,9) value of -13.432, indicating a neutral signal. The RSI at 65.832 suggests neutral condition and the Williams %R at 27.952 suggests buy condition. Please monitor closely.
More details about Ethereum (ETHUSD)
Recent Events and Risks:
- Spot ETF Outflow Reversal: Institutional demand has cooled as U.S. spot Ethereum ETFs snapped a multi-day inflow streak with net daily outflows, removing a primary source of spot market absorption and exposing the token to aggressive profit-taking.
- Derivatives Long Liquidation Cascades: Intraday price drops triggered tens of millions of dollars in forced long liquidations across perpetual futures contracts, creating a downside feedback loop as market depth thins and open interest contracts.
- Technical Resistance Rejection: Ether was repeatedly rejected at the key $2,780–$2,800 overhead resistance level, shifting short-term market structure to defensive and leaving lower demand zones near $2,620 and $2,550 vulnerable to retests.
- Macro Risk-Off and High Yield Pressure: Elevated U.S. Treasury yields, persistent geopolitical uncertainties, and cautious positioning ahead of major economic data releases continue to constrain institutional risk appetite across high-beta digital assets.
This article may include AI-generated content that is human-reviewed, which is for reference and general information purposes only and does not constitute investment advice.
Recommended Articles









Comments (0)
Click the $ button, enter the symbol, and select to link a stock, ETF, or other ticker.