


Corning Inc Stock (GLW) Moved Down by 3.30% on Sep 30: What Signal Does It Send?



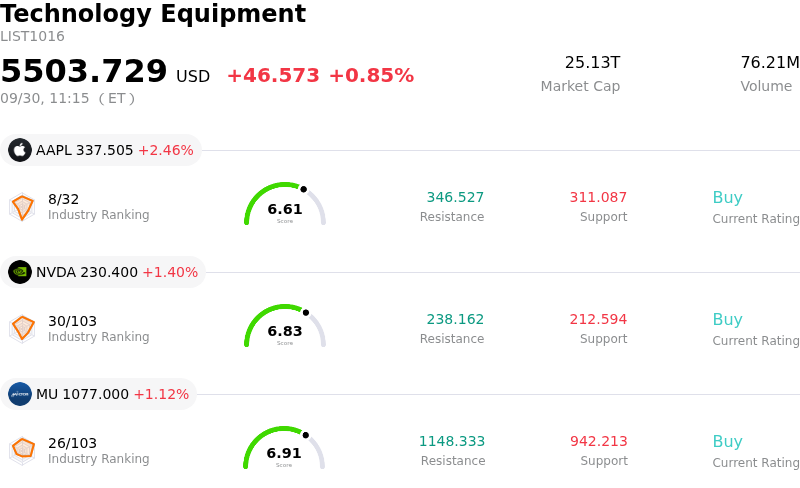
Corning Inc (GLW) moved down by 3.30%. The Technology Equipment sector is up by 0.85%. The company underperformed the industry. Top 3 stocks by turnover in the sector: Apple Inc (AAPL) up 2.52%; NVIDIA Corp (NVDA) up 1.41%; Micron Technology Inc (MU) up 1.10%.
What is driving Corning Inc (GLW)’s stock price down today?
Corning Incorporated experienced a noticeable pullback driven primarily by profit-taking and cautious analyst sentiment following a strong multi-session rally. Analysts at Sanford C. Bernstein initiated coverage on the company with a neutral rating and a price target well below recent trading levels, noting that market pricing already reflects much of the optimism surrounding long-term optical connectivity demand. Coming off back-to-back momentum surges triggered by multi-billion-dollar fiber optic supply agreements with major telecommunications providers like AT&T and Verizon, short-term market participants used the broker's conservative outlook as a prompt to lock in recent gains.
While Corning continues to strengthen its long-term growth narrative through strategic initiatives under its Springboard framework and joint technological demonstrations in AI data-center optical interconnects, its elevated earnings multiple leaves the equity sensitive to valuation adjustments. Additional overhead friction stems from lingering investor awareness regarding potential share dilution tied to its capital distribution program, which is designed to fund expansion plans. The combination of an analyst downgrade to neutral coverage, elevated valuation metrics, and post-news profit-taking created intraday volatility and drove shares lower as institutional buyers temporarily stepped aside.
Technical Analysis of Corning Inc (GLW)
Technically, Corning Inc (GLW) shows a MACD (12,26,9) value of 0.961, indicating a neutral signal. The RSI at 49.162 suggests neutral condition and the Williams %R at 57.575 suggests sell condition. Please monitor closely.
Media Coverage of Corning Inc (GLW)
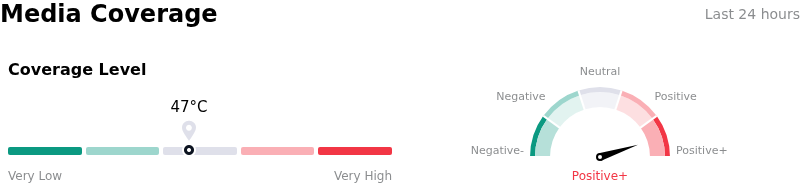
In terms of media coverage, Corning Inc (GLW) shows a coverage score of 47, indicating a moderate level of media attention. The overall market sentiment index is currently in extremely bullish zone.
Fundamental Analysis of Corning Inc (GLW)
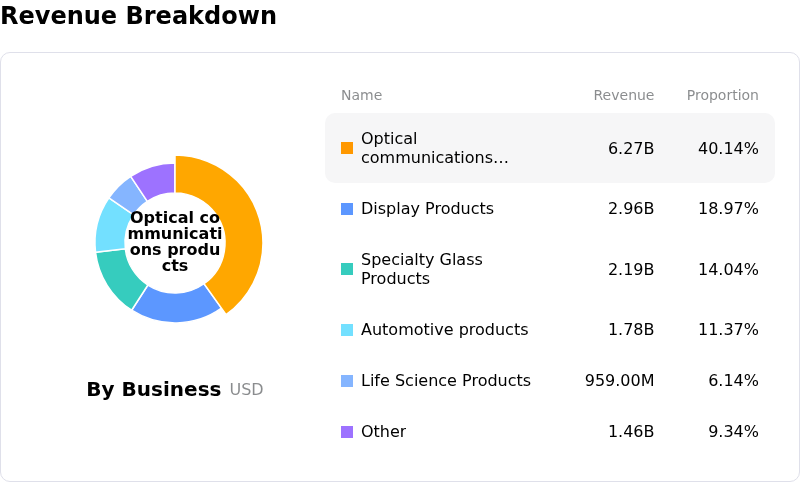
Corning Inc (GLW) is in the Technology Equipment industry. Its latest annual revenue is $15.63B, ranking 7 in the industry. The net profit is $1.60B, ranking 3 in the industry. Company Profile
Over the past month, multiple analysts have rated the company as Buy, with an average price target of $190.15, a high of $238.00, and a low of $129.00.
More details about Corning Inc (GLW)
Company Specific Risks:
- Dilutive Equity Overhang from $2.0 Billion ATM Program: Corning's SEC Form 8-K filing detailing an At-The-Market equity distribution agreement with Goldman Sachs to issue and sell up to $2.0 billion in common stock creates persistent share dilution risk, generating immediate price pressure and intraday volatility as markets price in increased share supply.
- Cautious Analyst Coverage and Below-Market Price Targets: Institutional sentiment was dampened after Sanford C. Bernstein initiated coverage on September 30, 2026, with a "Market Perform" rating and a $140.00 price target—implying roughly 12% downside—adding to recent price target reductions from Mizuho and Oppenheimer tied to lofty expectations and valuation limits.
- Stretched Valuation Multiples and Compression Vulnerability: Following an aggressive AI-driven rally, GLW is trading at a trailing P/E ratio near 70x, significantly above its 5-year historical median, making the stock highly sensitive to profit-taking, momentum reversals, and rapid multiple compression during sector risk-off moves.
- High Capital Expenditure Intensity and Hyperscaler Concentration: Ramping global production capacity to meet multi-year optical fiber commitments demands extensive upfront capital expenditures that threaten near-term cash flows, while leaving top-line growth heavily dependent on the uninterrupted spending budgets of a concentrated group of telecom and hyperscaler customers.
This article may include AI-generated content that is human-reviewed, which is for reference and general information purposes only and does not constitute investment advice.
Recommended Articles








Comments (0)
Click the $ button, enter the symbol, and select to link a stock, ETF, or other ticker.