


Solana (SOLUSD) Fluctuated Significantly on Sep 30: Key Variables Behind the Move



Solana (SOLUSD) is up 1.75% at Sep 30 08:35(ET), now at $120.12, with a 7-day up of 6.26%.
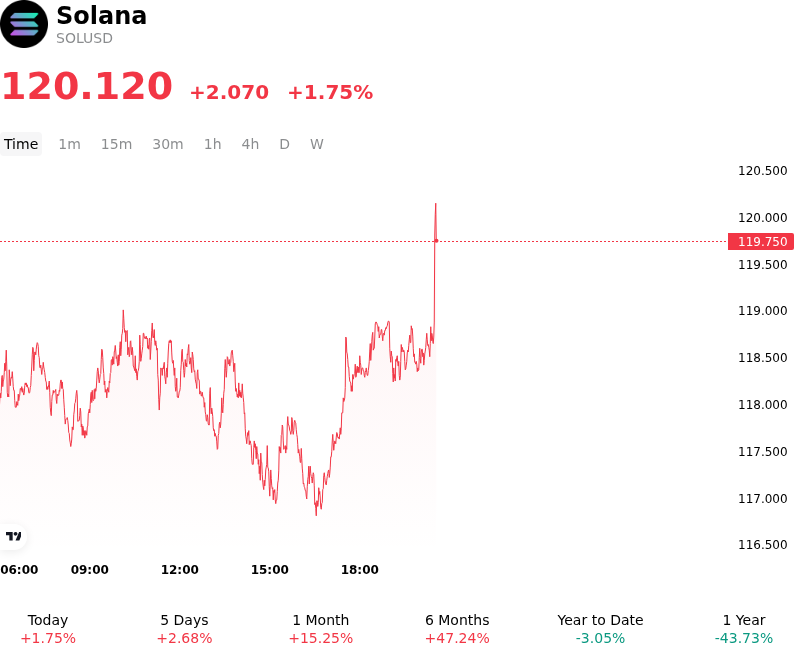
What is driving Solana (SOLUSD)’s stock price up today?
Institutional capital inflows into spot Solana exchange-traded products provided a foundational bid for the asset, driven by sustained net inflows across spot vehicles and growing allocator preference for staking-backed fund structures. Buying interest from institutional asset managers and regular fund accumulation reinforced secondary market depth. Market liquidity and trading accessibility were further bolstered by expansion in regulated crypto derivatives channels, notably the introduction of Solana perpetual futures on retail and institutional platforms. This expansion broadened buy-side participation, elevated open interest in perpetual contracts, and supported favorable funding rates.
Network infrastructure advancements and institutional tokenization initiatives significantly boosted long-term adoption expectations. On-chain performance optimizations, including the transition toward lower target slot times of 250 milliseconds, demonstrated tangible improvements in throughput and transaction confirmation efficiency. Anticipation surrounding subsequent consensus-layer enhancements, such as the Alpenglow framework aimed at slashing transaction finality latency, further strengthened technical sentiment. Concurrently, enterprise adoption received momentum from institutional real-world asset tokenization initiatives, including integrations connecting global fund distribution networks with Solana, reinforced by supportive regulatory frameworks for on-chain securities.
Sustained on-chain liquidity and decentralized finance (DeFi) metrics provided organic spot demand to absorb profit-taking. Rising fee generation across primary decentralized exchanges, coupled with elevated stablecoin transaction volumes and a high network staking ratio, underscored robust active usage. Although broader digital asset markets navigated localized consolidation and quarter-end macroeconomic rebalancing, Solana's capital inflows reflected relative structural strength rather than purely speculative leverage. Investors continue to monitor perpetual derivatives positioning, ETF flow continuity, and validator adoption rates for incoming protocol upgrades to gauge whether current price levels can firmly establish a base for sustained upside.
Technical Analysis of Solana (SOLUSD)
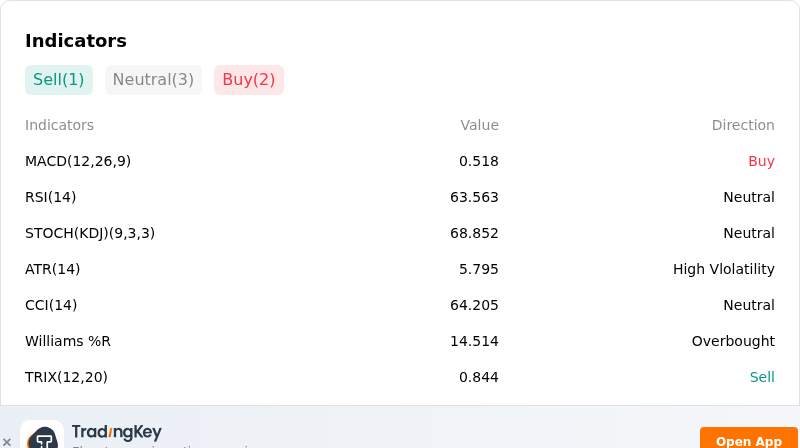
Technically, Solana (SOLUSD) shows a MACD (12,26,9) value of 0.518, indicating a buy signal. The RSI at 63.563 suggests neutral condition and the Williams %R at 14.514 suggests overbought condition. Please monitor closely.
More details about Solana (SOLUSD)
Recent Events and Risks:
- Deceleration in Institutional ETF Inflows: Following a record single-session influx, U.S. spot Solana ETF inflows slowed sharply down to $7.7 million on September 28, driven by net redemptions in funds like VanEck's VSOL, signaling a rapid cooling in institutional buying pressure that leaves spot order books vulnerable to downside retests.
- Over-Leveraged Long Bias and Liquidation Concentration: Derivatives positioning remains heavily tilted toward longs with Binance accounts showing a 1.79 long-to-short ratio and futures open interest holding around $7.07 billion, leaving market structure exposed to forced liquidation cascades if price breaches the dense long liquidation cluster near $117.00.
- Intraday Technical Breakdown and Trendline Rejection: Lower timeframe charts display bearish momentum divergence and a breakdown below recent ascending trendlines, creating immediate downside risk toward lower support levels at $116.32 and $112.50 if current pivots fail to hold.
- Macro Risk-Off and Altcoin Liquidity Drain: A broader 3.3% contraction in total cryptocurrency market capitalization driven by rising U.S. Treasury yields has pushed Bitcoin dominance up to 58.3%, draining liquidity away from high-beta altcoins like Solana and increasing intraday downside volatility.
This article may include AI-generated content that is human-reviewed, which is for reference and general information purposes only and does not constitute investment advice.
Recommended Articles









Comments (0)
Click the $ button, enter the symbol, and select to link a stock, ETF, or other ticker.