


XRP (XRPUSD) Suddenly Goes down 1.36% on Sep 29: What's Driving This



XRP (XRPUSD) is down 1.36% at Sep 29 21:20(ET), now at $1.4744, with a 7-day down of 6.18%.
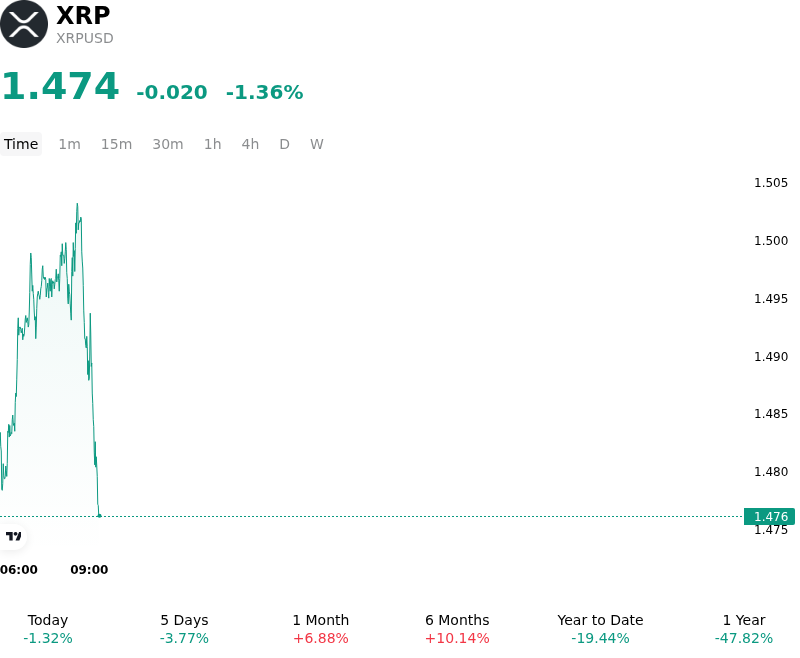
What is driving XRP (XRPUSD)’s stock price down today?
XRP experienced heightened intraday volatility and a modest decline as broader macroeconomic headwinds dampened risk appetite across the digital asset market. A persistent push in benchmark U.S. Treasury yields alongside renewed strength in the U.S. dollar index created restrictive liquidity conditions, curtailing short-term capital allocations to non-yielding asset classes. As market participants recalibrated their expectations around federal interest rate trajectories and persistent inflationary signals, broad crypto market sentiment shifted toward defensive positioning, prompting selective deleveraging across major altcoin pairs.
The downside pressure in XRP was further exacerbated by localized profit-taking following its recent rally toward key overhead technical resistance levels. Having outpaced several major cryptocurrencies over prior sessions, short-term derivatives positioning underwent moderate unwinding, with futures funding rates easing as long leverage was flushed out. Concurrently, traders digested ongoing supply dynamics, including scheduled escrow releases, alongside market commentary regarding capital allocation across cross-border settlement rails and proprietary stablecoin infrastructure. This led to tactical portfolio rebalancing by institutional and sophisticated market participants.
Despite the brief pullback, the asset's structural thesis remains underpinned by expanding institutional interest in blockchain-based cross-border liquidity and ongoing discussions surrounding enterprise payment integration. However, institutional investors continue to monitor several key risks, including macroeconomic liquidity tightening, leverage concentration in perpetual futures markets, and evolving regulatory frameworks surrounding digital asset classifications and cross-border settlement rails.
Technical Analysis of XRP (XRPUSD)
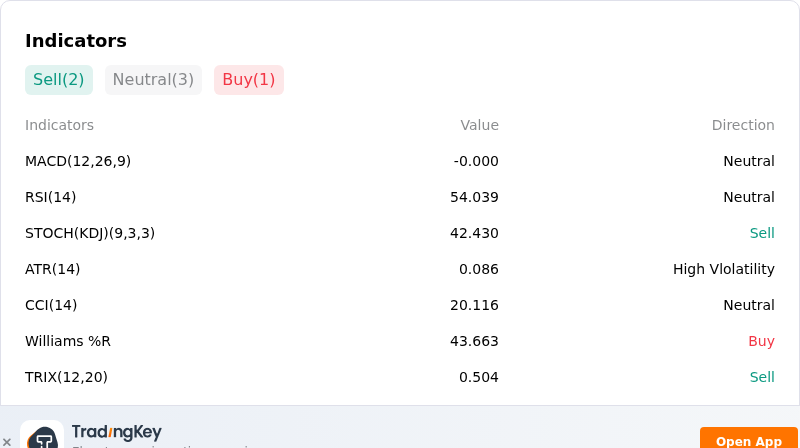
Technically, XRP (XRPUSD) shows a MACD (12,26,9) value of -0.000, indicating a neutral signal. The RSI at 54.039 suggests neutral condition and the Williams %R at 43.663 suggests buy condition. Please monitor closely.
More details about XRP (XRPUSD)
Recent Events and Risks:
- Key Support Breakdown and Rejection at Resistance: XRP lost its critical $1.50 support pivot, declining toward $1.47 following repeated failed attempts to clear resistance between $1.57 and $1.63. Technical analysts warn that failing to quickly reclaim $1.50 risks exposing downside targets toward the 200-day exponential moving average at $1.37 and potential double-top neckline support near $1.28.
- Structural Supply Pressure and Overhead Selling: Perpetual supply overhang—driven by Ripple's monthly escrow release structure alongside historical holders selling into price bounces to recover legacy capital—continues to cap upside momentum. This structural supply dynamic leaves the order book vulnerable to liquidity shocks whenever spot demand fades.
- Macro Crypto Weakness and High-Beta Sensitivity: Broad digital asset market contraction, marked by Bitcoin falling below $83,000 and Ethereum dropping under $2,650 amid rising U.S. Treasury yields and geopolitical risk-off sentiment, has magnified intraday downside for XRP. As a high-beta large-cap asset, XRP experiences steeper percentage declines than Bitcoin during cross-market sell-offs.
- Regulatory Stagnation and Policy Overhead: Persistent policy uncertainty in the United States, underscored by legislative delays and the U.S. Senate's failure to advance key digital asset market clarity legislation, continues to act as an operational headwind for XRP, keeping institutional participation cautious despite spot ETF activity.
This article may include AI-generated content that is human-reviewed, which is for reference and general information purposes only and does not constitute investment advice.
Recommended Articles









Comments (0)
Click the $ button, enter the symbol, and select to link a stock, ETF, or other ticker.