


Newmont Corporation Stock (NEM) Moved Down by 4.45% on Sep 28: Facts Behind the Movement



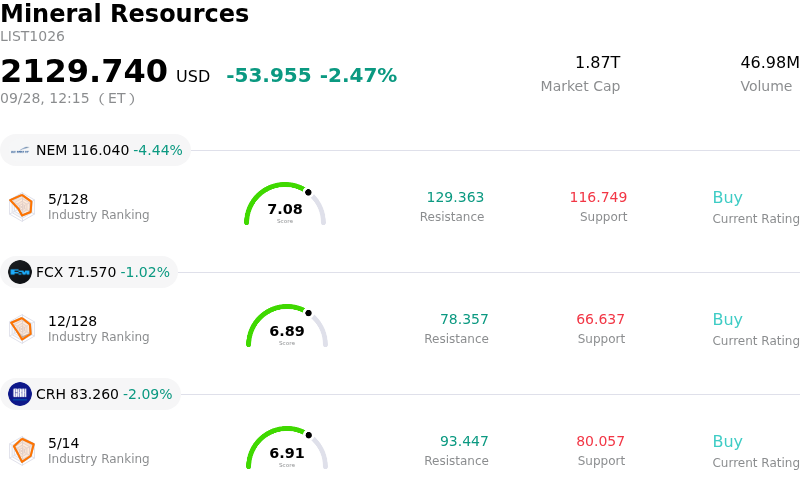
Newmont Corporation (NEM) moved down by 4.45%. The Mineral Resources sector is down by 2.47%. The company underperformed the industry. Top 3 stocks by turnover in the sector: Newmont Corporation (NEM) down 4.44%; Freeport-McMoRan Inc (FCX) down 1.02%; CRH PLC (CRH) down 2.09%.
What is driving Newmont Corporation (NEM)’s stock price down today?
Newmont Corporation experienced notable downward pressure today primarily driven by a sharp selloff in the underlying precious metals market. Bullion prices dropped significantly following a broader risk repricing across global financial markets. Resurgent crude oil prices stoked renewed inflation concerns, which in turn spurred a rise in U.S. Treasury yields and strengthened market expectations that the Federal Reserve will maintain a hawkish monetary policy stance. Higher interest rate expectations and elevated bond yields increase the opportunity cost of holding non-yielding safe-haven assets, triggering widespread liquidations in spot gold and silver contracts.
As the world's leading gold mining enterprise, Newmont's fundamental revenue generation and cash flows remain tightly tied to prevailing gold prices. When underlying commodity prices experience steep intraday declines, mining stocks typically exhibit amplified volatility relative to spot bullion due to operational and financial leverage. The sudden retreat in gold prices erased recent technical support levels for gold equities, prompting institutional portfolio managers and momentum traders to reduce exposure across the basic materials sector.
Despite the day's selloff, Newmont continues to maintain strong financial liquidity, robust free cash flow, and active shareholder return initiatives, supported by ongoing share repurchases and regular dividend distributions. However, near-term stock trajectory remains heavily dictated by macroeconomic catalysts, bond market dynamics, and shifting expectations regarding central bank policy ahead of key economic data releases. Investor focus is expected to stay centered on commodity price stability and operational execution ahead of the company's upcoming earnings report.
Technical Analysis of Newmont Corporation (NEM)
Technically, Newmont Corporation (NEM) shows a MACD (12,26,9) value of -3.132, indicating a neutral signal. The RSI at 41.087 suggests neutral condition and the Williams %R at 91.104 suggests oversold condition. Please monitor closely.
Media Coverage of Newmont Corporation (NEM)
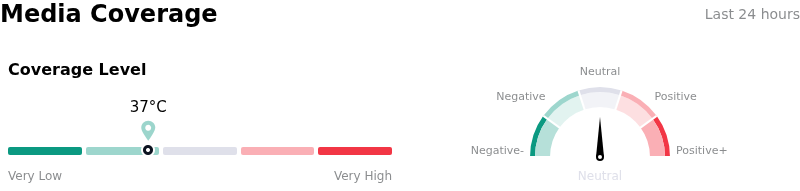
In terms of media coverage, Newmont Corporation (NEM) shows a coverage score of 37, indicating a low level of media attention. The overall market sentiment index is currently in neutral zone.
Fundamental Analysis of Newmont Corporation (NEM)
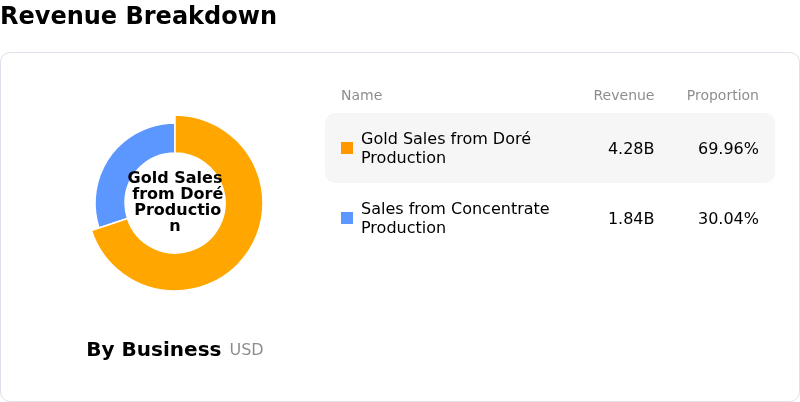
Newmont Corporation (NEM) is in the Mineral Resources industry. Its latest annual revenue is $22.67B, ranking 10 in the industry. The net profit is $7.08B, ranking 3 in the industry. Company Profile
Over the past month, multiple analysts have rated the company as Buy, with an average price target of $140.36, a high of $205.00, and a low of $79.00.
More details about Newmont Corporation (NEM)
Company Specific Risks:
- Escalating All-In Sustaining Costs and CapEx: Sustained inflationary pressures on All-In Sustaining Costs (AISC) alongside substantial capital expenditure requirements for ongoing global project expansions threaten to compress operating profit margins and limit free cash flow growth.
- Valuation Premium and Analyst Target Revisions: Newmont trades at a Forward PEG ratio of 1.73—significantly higher than the gold mining industry average of 0.94—exposing the stock to valuation multiple contraction following recent target price trims and rating downgrades from major brokerages.
- Executive Insider Share Liquidation: Recent Form 4 and Form 144 SEC filings reveal concurrent stock sales by key management figures, including President and CEO Natascha Viljoen and Executive Vice President Peter Toth, triggering cautionary market sentiment regarding insider positioning.
- Operational Ore Grade Constraints and Gold Volatility: Headwinds from processing lower-grade ore across core operational assets create volume production risks, while high sensitivity to shifting interest rate expectations and spot gold price pullbacks exacerbates intraday trading volatility.
This article may include AI-generated content that is human-reviewed, which is for reference and general information purposes only and does not constitute investment advice.
Recommended Articles







Comments (0)
Click the $ button, enter the symbol, and select to link a stock, ETF, or other ticker.