


Marvell Technology Inc Stock (MRVL) Moved Down by 3.90% on Sep 28: Drivers Behind the Movement



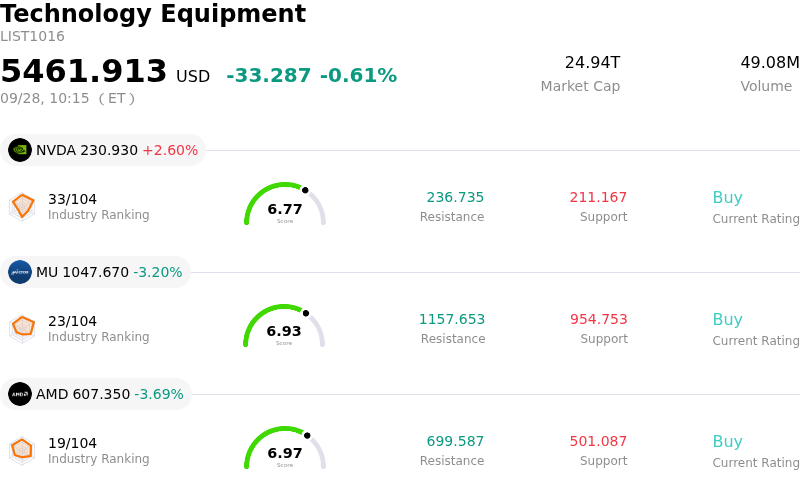
Marvell Technology Inc (MRVL) moved down by 3.90%. The Technology Equipment sector is down by 0.61%. The company underperformed the industry. Top 3 stocks by turnover in the sector: NVIDIA Corp (NVDA) up 2.59%; Micron Technology Inc (MU) down 3.35%; Advanced Micro Devices Inc (AMD) down 3.69%.
What is driving Marvell Technology Inc (MRVL)’s stock price down today?
Marvell Technology experienced downward pressure during the trading session, largely driven by short-term profit-taking and broader rebalancing across the high-beta semiconductor sector. Following a significant year-to-date run-up fueled by booming artificial intelligence infrastructure demand and expanding custom silicon engagements, investors took the opportunity to de-risk ahead of upcoming corporate events. The broader technology sector faced general headwinds, with high-growth chipmakers bearing the brunt of intraday position adjustments.
Valuation optics continue to play a central role in short-term sentiment surrounding the stock. Having priced in aggressive growth targets for data center revenue, optical interconnect deployments, and custom application-specific integrated circuit expansion, the equity trades at premium valuation multiples relative to historical averages and industry peers. When elevated growth expectations are heavily embedded into share valuations, even minor shifts in broader market sentiment or macro interest rate expectations can spark heightened volatility and prompt technical pullbacks.
Market participants are also navigating competitive dynamics within the custom cloud silicon and AI networking ecosystem. While Marvell maintains strong customer relationships across key hyperscalers and recently unveiled advanced optical interconnect technology, intense competition from rival chip designers for lucrative custom accelerator designs remains a persistent point of debate among institutional investors.
Looking ahead, institutional focus is shifting toward the company's upcoming Investor Day, where management is expected to provide detailed multi-year visibility regarding data center infrastructure expansion, custom silicon traction, and fiscal growth targets. Until clearer guidance emerges from upcoming corporate updates, the stock may remain subject to elevated volatility as traders balance rich valuation multiples against compelling long-term secular growth drivers in artificial intelligence.
Technical Analysis of Marvell Technology Inc (MRVL)
Technically, Marvell Technology Inc (MRVL) shows a MACD (12,26,9) value of 5.065, indicating a buy signal. The RSI at 57.086 suggests neutral condition and the Williams %R at 29.079 suggests buy condition. Please monitor closely.
Media Coverage of Marvell Technology Inc (MRVL)
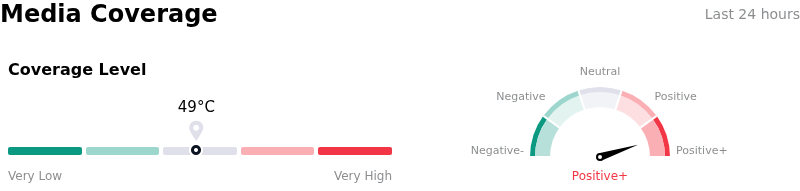
In terms of media coverage, Marvell Technology Inc (MRVL) shows a coverage score of 49, indicating a moderate level of media attention. The overall market sentiment index is currently in extremely bullish zone.
Fundamental Analysis of Marvell Technology Inc (MRVL)
Marvell Technology Inc (MRVL) is in the Technology Equipment industry. Its latest annual revenue is $8.19B, ranking 19 in the industry. The net profit is $2.67B, ranking 13 in the industry. Company Profile
Over the past month, multiple analysts have rated the company as Buy, with an average price target of $282.03, a high of $400.00, and a low of $90.00.
More details about Marvell Technology Inc (MRVL)
Company Specific Risks:
- Gross Margin Compression via Product Mix Shift: Rapid revenue expansion in custom silicon programs for hyperscalers is structurally dragging down corporate profitability, with non-GAAP gross margins projected to contract from 58.9% into the 57.5%–58.5% range due to lower-margin ASIC profiles relative to legacy optical hardware.
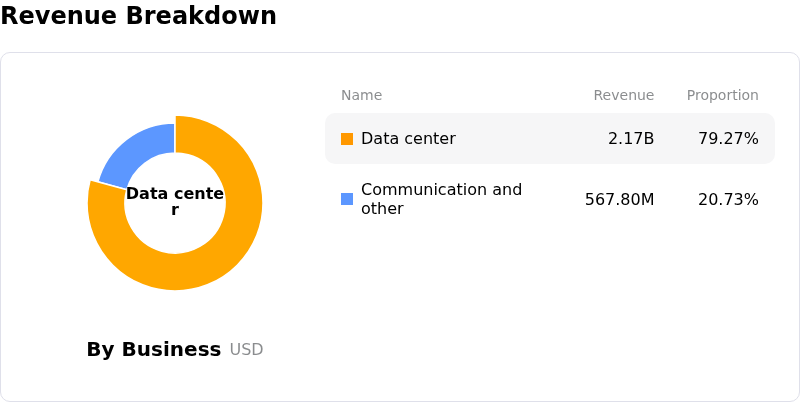
- Hyperscaler Concentration and Multi-Sourcing Vulnerability: With data center operations contributing roughly 79% of total revenues, performance remains heavily exposed to concentrated spending from major cloud providers (AWS, Google, Microsoft) alongside active multi-sourcing threats from rivals like Broadcom and Qualcomm.
- Deferred Monetization Timelines on Major AI Deals: Key hyperscaler agreements—including custom chip design wins and strategic warrant structures—feature extended operational lead times that defer significant revenue ramps into FY2028–FY2029, triggering institutional frustration over near-term capital intensity versus delayed cash flow realization.
- Elevated Valuation Premium and Pre-Event Volatility: Carrying a high price-to-earnings ratio near 86x alongside implied options volatility of over 67%, the stock faces elevated downside risk bands as institutional investors de-risk positions ahead of the October 6 Investor Day.
This article may include AI-generated content that is human-reviewed, which is for reference and general information purposes only and does not constitute investment advice.
Recommended Articles







Comments (0)
Click the $ button, enter the symbol, and select to link a stock, ETF, or other ticker.