


Solana (SOLUSD) Suddenly Goes down 1.06% on Sep 8: What You Need to Watch



Solana (SOLUSD) is down 1.06% at Sep 8 01:00(ET), now at $102.01, with a 7-day up of 2.93%.
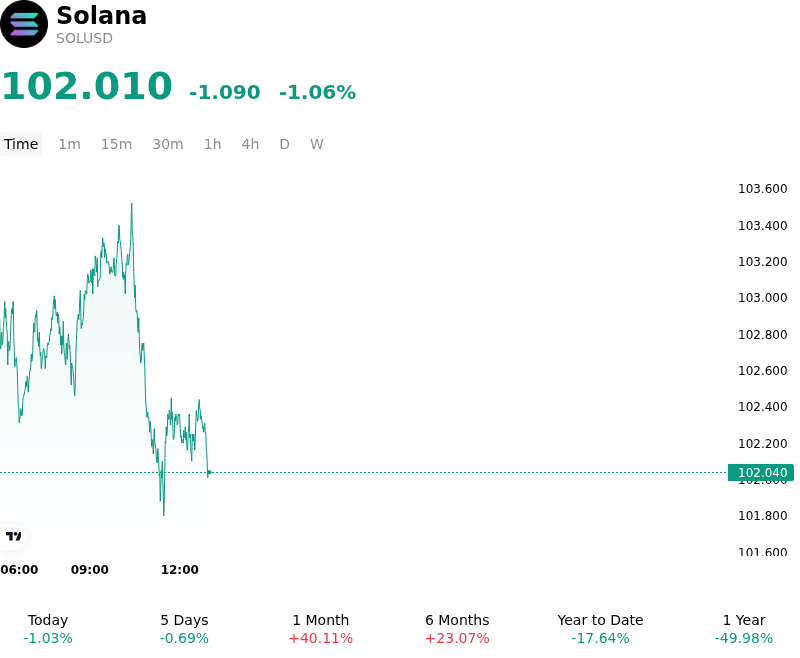
What is driving Solana (SOLUSD)’s stock price down today?
Solana pulled back as broader digital asset markets digested a tightening macroeconomic backdrop and a temporary slowdown in institutional capital flows. Recent economic indicators in the United States reinforced market expectations of persistent Federal Reserve policy rates and elevated Treasury yields. This firming of the U.S. dollar and real yields weighed on high-beta Layer-1 tokens, dampening speculative risk appetite and prompting a broad-based repricing across alternative smart-contract platforms.
Spot ETF demand dynamics also contributed to the softer trading session. Following a surge in institutional inflows during late August that propelled the token toward key multi-week resistance levels, spot Solana ETF creations experienced a notable deceleration in early September. The reduction in net institutional buying reduced the marginal bid required to absorb overhead supply, allowing short-term sellers to dictate intraday price discovery.
In the derivatives market, positioning shifts accelerated the downward bias. Derivatives traders engaged in selective profit-taking and long liquidations following repeated rejections near key technical overhead resistance. Funding rates normalized across major cryptocurrency exchanges as market participants actively derisked portfolios ahead of pivotal macroeconomic data releases and upcoming central bank meetings. The unwinding of leveraged positions exacerbated spot market softness despite underlying order book depth remaining intact.
From a structural perspective, Solana maintains constructive network fundamentals, including steady decentralized exchange trading turnover, resilient developer engagement, and ongoing protocol upgrades aimed at enhancing execution performance. However, near-term price action remains heavily tethered to global macro liquidity conditions and institutional spot product momentum. Investors continue to monitor Treasury yield trajectories, broader risk sentiment, and ETF net flow consistency to gauge whether the retracement represents a temporary consolidation or a broader pause in altcoin capital allocations.
Technical Analysis of Solana (SOLUSD)
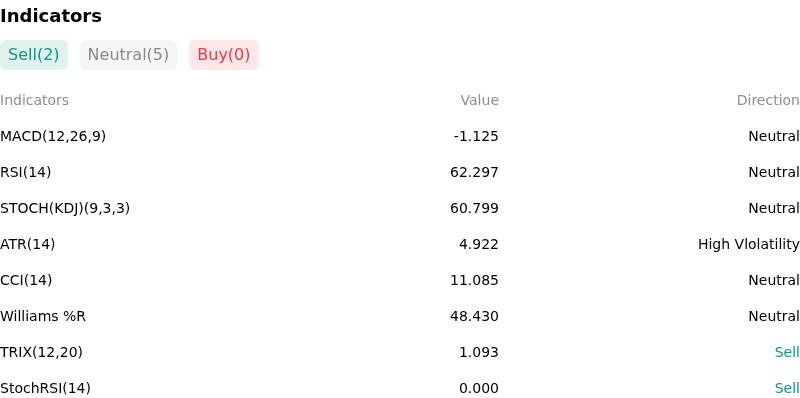
Technically, Solana (SOLUSD) shows a MACD (12,26,9) value of -1.125, indicating a neutral signal. The RSI at 62.297 suggests neutral condition and the Williams %R at 48.430 suggests neutral condition. Please monitor closely.
More details about Solana (SOLUSD)
Recent Events and Risks:
- Resistance Rejection and Momentum Fatigue: Solana experienced repeated rejections at the critical $106.80–$108.50 resistance shelf, retreating toward $104 while daily MACD histogram readings flipped negative, indicating decelerating buying pressure and an increased risk of a pullback toward the $95.56 support zone.
- Leveraged Long Liquidations: A broader crypto market sell-off triggered over $369 million in derivatives liquidations, wiping out nearly $30 million in SOL long positions and exposing dense liquidation clusters that threaten cascading unwinds if the $100 psychological threshold is breached.
- On-Chain Fee and Trading Volume Divergence: On-chain decentralized exchange metrics show sharp short-term fee declines on key platforms such as PumpSwap and HumidiFi, underscoring SOL's vulnerability to cooling speculative activity and memecoin trading volumes.
- Macro Risk-Off Pressures: Firming U.S. Treasury yields and tighter monetary policy expectations have sparked cross-asset risk aversion, reducing marginal capital inflows into high-beta altcoins while potential regulatory overhauls maintain overhead market uncertainty.
This article may include AI-generated content that is human-reviewed, which is for reference and general information purposes only and does not constitute investment advice.
Recommended Articles








Comments (0)
Click the $ button, enter the symbol, and select to link a stock, ETF, or other ticker.