


Harmony Gold Mining Company Ltd Stock (HMY) Moved Up by 7.20% on Aug 21: Facts Behind the Movement



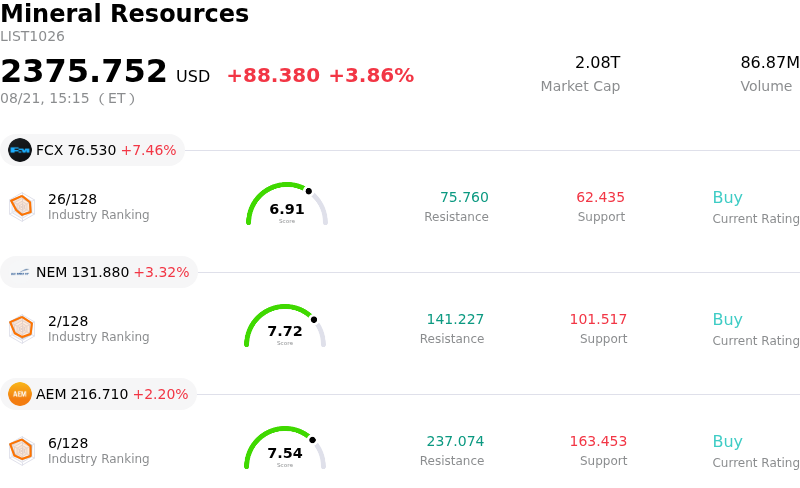
Harmony Gold Mining Company Ltd (HMY) moved up by 7.20%. The Mineral Resources sector is up by 3.86%. The company outperformed the industry. Top 3 stocks by turnover in the sector: Freeport-McMoRan Inc (FCX) up 7.46%; Newmont Corporation (NEM) up 3.32%; Agnico Eagle Mines Ltd (AEM) up 2.20%.
What is driving Harmony Gold Mining Company Ltd (HMY)’s stock price up today?
Harmony Gold Mining Company Limited experienced strong upward momentum following the release of an exceptionally bullish trading statement and operational update for the full financial year. The primary driver behind the positive price movement was a substantial upward revision in full-year earnings guidance, powered by elevated metal prices and solid operational execution. The company signaled that its fiscal full-year earnings per share are projected to more than double compared to the prior fiscal year, driven by a sharp rise in average realized gold prices and revenue contributions from newly integrated copper assets.
Beyond top-line revenue expansion, the company benefited from significant non-cash gains, including a multi-million dollar impairment reversal across several of its South African underground gold operations. This reversal was prompted by higher long-term gold price assumptions applied in asset valuations, underscoring the broader profitability of its portfolio. Furthermore, Harmony Gold achieved its annual gold production targets for the eleventh consecutive year while maintaining all-in sustaining costs within guidance, reinforcing investor confidence in management's operational discipline and execution consistency.
The market also reacted favorably to the strategic progress made in diversifying the miner's revenue stream. Contributions from the newly acquired copper mine reached the upper end of production guidance, proving that the company's shift toward becoming a dual gold and copper producer is delivering tangible financial rewards. Despite higher royalty expenses, mining taxes, and integration costs associated with the acquisition, the leverage gained from surging commodity prices far outweighed cost pressures, sparking strong buying interest and constructive sentiment across the market.
Technical Analysis of Harmony Gold Mining Company Ltd (HMY)
Technically, Harmony Gold Mining Company Ltd (HMY) shows a MACD (12,26,9) value of 0.850, indicating a buy signal. The RSI at 78.033 suggests buy condition and the Williams %R at 0.369 suggests overbought condition. Please monitor closely.
Fundamental Analysis of Harmony Gold Mining Company Ltd (HMY)
Harmony Gold Mining Company Ltd (HMY) is in the Mineral Resources industry. Its latest annual revenue is $4.07B, ranking 30 in the industry. The net profit is $792.48M, ranking 22 in the industry. Company Profile
Over the past month, multiple analysts have rated the company as Hold, with an average price target of $20.73, a high of $23.50, and a low of $16.68.
More details about Harmony Gold Mining Company Ltd (HMY)
Company Specific Risks:
- Surging Tax and Royalty Obligations: In its August 21 trading update, Harmony Gold reported a R1.5 billion (~$95 million) increase in South African mining royalty expenses and a R2.3 billion (~$162 million) jump in tax expenses, as higher gold revenues drove the company into higher tax and royalty tiers.
- Escalating Production Costs and M&A Expenses: Operating profitability faces headwinds from consumable and electricity price inflation, higher labor costs stemming from a five-year wage agreement, and approximately R1.4 billion ($90+ million) in acquisition and integration costs tied to MAC Copper and the CSA mine.
- Derivative Hedging Losses on Metal Contracts: Harmony disclosed realized losses on derivative silver contracts, as market spot prices climbed significantly above the company's locked-in contract rates, capping revenue upside on hedged sales.
- Technical Overbought Signals and Valuation Stretch: Rapid price appreciation pushed technical momentum into overbought territory with an RSI above 80, while the stock traded at a 16% to 20% premium over estimated fair value, exposing shares to profit-taking ahead of full financial results on August 27.
This article may include AI-generated content that is human-reviewed, which is for reference and general information purposes only and does not constitute investment advice.
Recommended Articles








Comments (0)
Click the $ button, enter the symbol, and select to link a stock, ETF, or other ticker.