


Ethereum (ETHUSD) Fluctuated Significantly on Aug 19: Key Variables Behind the Move



Ethereum (ETHUSD) is up 1.05% at Aug 19 08:45(ET), now at $1930.55, with a 7-day up of 2.47%.
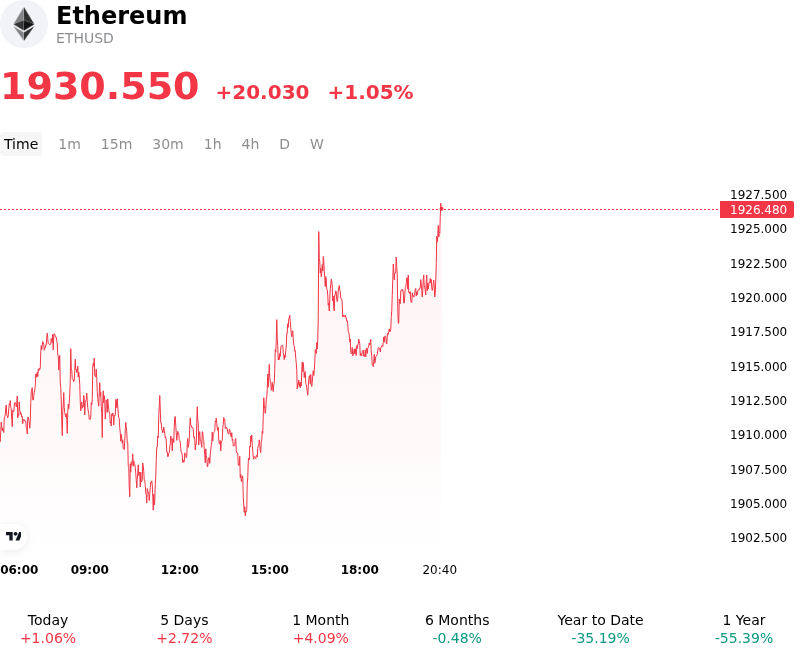
What is driving Ethereum (ETHUSD)’s stock price up today?
Capital flowed into Ethereum as digital asset market sentiment improved following pivotal regulatory updates in the United States. The Securities and Exchange Commission introduced its proposed Regulation Crypto Assets framework, establishing clear securities registration exemptions and signaling a structural transition away from aggressive enforcement tactics toward transparent compliance pathways. This regulatory evolution, alongside market anticipation surrounding top-level discussions between policy makers and crypto industry leaders, helped mitigate systemic policy uncertainty and bolstered institutional risk appetite. Furthermore, stabilizing Treasury yield dynamics and recalibrated Federal Reserve policy expectations provided a favorable macroeconomic backdrop for digital assets.
Asset-specific demand was reinforced by steady spot Ethereum ETF inflows, demonstrating sustained institutional capital allocation toward core smart-contract infrastructure. On-chain supply metrics further supported the upward trajectory, as a record proportion of Ether remained locked within staking contracts, restricting circulating liquid supply across major spot exchanges. Institutional interest in yield-bearing digital asset structures and the expanding deployment of Ethereum-based stablecoin settlement networks underscored the asset's structural appeal as both a monetary settlement engine and a yield-generating instrument, effectively dampening spot sell-side pressure.
From a market structure viewpoint, the price advance was facilitated by healthy derivatives positioning and technical defense of key moving averages and retracement support levels. As leverage cleared around key technical zones, persistent spot buying gradually absorbed overhead liquidity, encouraging orderly short covering. Although institutional investors continue to monitor broader macroeconomic risks—including sticky bond yields, geopolitical developments, and implementation details of pending regulatory legislation—the asset's price behavior reflects a constructive interplay between structural supply constraints and improving institutional confidence.
Technical Analysis of Ethereum (ETHUSD)
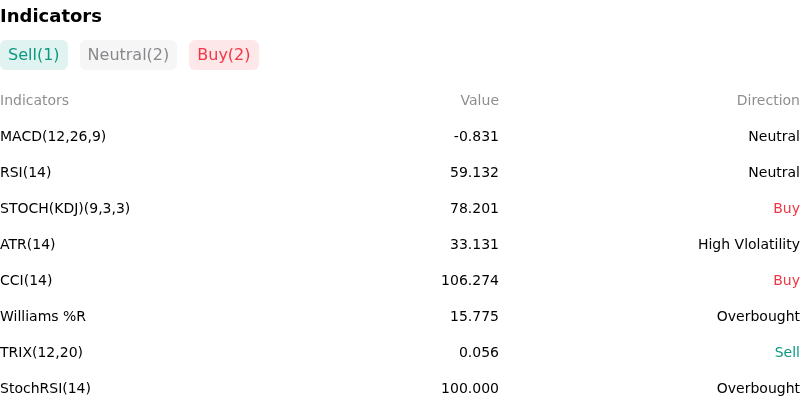
Technically, Ethereum (ETHUSD) shows a MACD (12,26,9) value of -0.831, indicating a neutral signal. The RSI at 59.132 suggests neutral condition and the Williams %R at 15.775 suggests overbought condition. Please monitor closely.
More details about Ethereum (ETHUSD)
Recent Events and Risks:
- Spot ETF Capital Outflows: Spot Ethereum ETFs recently recorded a reversal to net weekly outflows of $2.26 million, snapping a five-week consecutive inflow streak as funds such as BlackRock's ETHA and Fidelity's FETH registered net redemptions, dampening institutional buying momentum.
- Whale Distribution and Exchange Inflows: On-chain data reveals persistent selling pressure from large holders, including multi-billion dollar distribution activity and dormant whale wallets moving thousands of ETH to centralized exchanges like Coinbase, FalconX, and Galaxy Digital, signaling overhead sell-side inventory.
- Leverage Liquidation and Resistance Rejection: Ethereum price surges toward $1,920–$1,930 continue to meet stiff technical resistance, leaving dense clusters of leveraged long positions between $1,850 and $1,870 vulnerable to liquidation cascades if immediate support breaks.
- Weakening Spot Demand Metrics: Market structure indicators reflect subdued spot accumulation, highlighted by a negative Coinbase Premium Index indicating weak appetite from U.S. institutional buyers alongside a marked contraction in decentralized exchange trading volumes.
This article may include AI-generated content that is human-reviewed, which is for reference and general information purposes only and does not constitute investment advice.
Recommended Articles









Comments (0)
Click the $ button, enter the symbol, and select to link a stock, ETF, or other ticker.