


Lam Research Corp Stock (LRCX) Moved Down by 6.00% on Aug 18: Key Drivers Unveiled



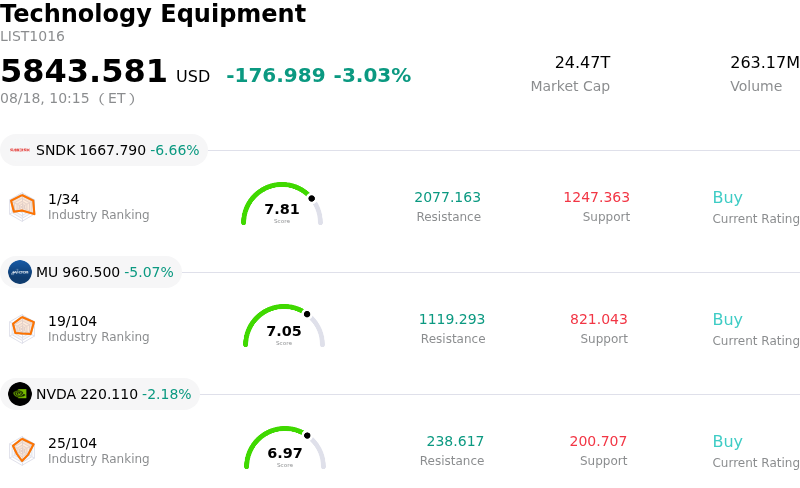
Lam Research Corp (LRCX) moved down by 6.00%. The Technology Equipment sector is down by 3.03%. The company underperformed the industry. Top 3 stocks by turnover in the sector: SanDisk Corporation (SNDK) down 6.66%; Micron Technology Inc (MU) down 5.07%; NVIDIA Corp (NVDA) down 2.18%.
What is driving Lam Research Corp (LRCX)’s stock price down today?
The downward movement in Lam Research Corporation reflects a combination of valuation-driven profit-taking and broader sector-wide adjustments across the semiconductor equipment industry. Following a prolonged rally fueled by enthusiasm surrounding artificial intelligence infrastructure and robust quarterly financial results, the stock traded at elevated valuation multiples compared to historical benchmarks. As momentum slowed across tech capital equipment peers, investors took profits to lock in gains, putting temporary selling pressure on the stock.
Market dynamics were further impacted by investor reactions to the company's long-term capital allocation plans. Although the announcement of a multi-billion-dollar commitment over the next five years to expand its global research and development lab network reinforces its competitive edge in advanced semiconductor manufacturing, it also introduces expectations of heightened capital intensity. In periods of macroeconomic caution, short-term investors often react sensitively to significant commitments of free cash flow toward expanded research infrastructure, prioritizing immediate cash returns over multi-year capital expenditure programs.
Recent regulatory disclosures detailing insider trading activity also contributed to cautious market sentiment. Disclosures showing stock sales by senior executives and directors, even when executed under pre-arranged trading plans, can create near-term overhead pressure when shares trade near upper valuation boundaries. Furthermore, quarterly institutional portfolio adjustments and fund rebalancing after strong prior performance added to the trading supply, driving intraday volatility and compounding the stock's decline.
Technical Analysis of Lam Research Corp (LRCX)
Technically, Lam Research Corp (LRCX) shows a MACD (12,26,9) value of 12.966, indicating a neutral signal. The RSI at 57.752 suggests neutral condition and the Williams %R at 1.519 suggests overbought condition. Please monitor closely.
Media Coverage of Lam Research Corp (LRCX)
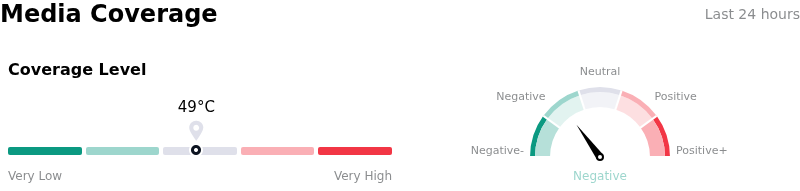
In terms of media coverage, Lam Research Corp (LRCX) shows a coverage score of 49, indicating a moderate level of media attention. The overall market sentiment index is currently in neutral zone.
Fundamental Analysis of Lam Research Corp (LRCX)
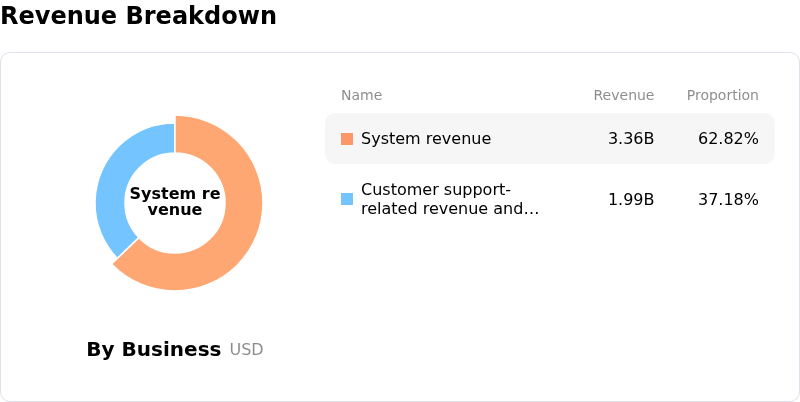
Lam Research Corp (LRCX) is in the Technology Equipment industry. Its latest annual revenue is $23.23B, ranking 12 in the industry. The net profit is $7.27B, ranking 7 in the industry. Company Profile
Over the past month, multiple analysts have rated the company as Buy, with an average price target of $366.38, a high of $500.00, and a low of $213.00.
More details about Lam Research Corp (LRCX)
Company Specific Risks:
- Capital Expenditure Burden and Near-Term Margin Compression: Following the company's announcement of a multi-year $3 billion investment to expand its global research and development laboratory network, institutional analysts warned that elevated capital deployment and rising operating expenditures threaten near-term gross margin targets and cash flow efficiency.
- Geopolitical Trade Restrictions and China Revenue Concentration: Disclosures in annual filings indicate China accounts for over 30% of total revenue ($7.86 billion), leaving top-line growth highly vulnerable to ongoing US export controls, trade rule adjustments, and potential restrictions on advanced wafer fabrication equipment shipments.
- Memory Market Cyclicality and Order Moderation: Analyst commentary highlights downside risks from potential High-Bandwidth Memory (HBM) and NAND overcapacity, where capital expenditure pullbacks or inventory rebalancing by major chipmakers could slow order velocity for Lam's etch and deposition tools.
- Elevated Valuation Multiple and De-rating Vulnerability: Trading at a trailing price-to-earnings ratio above 50x—well above industry averages and historical medians—the stock exhibits heightened sensitivity to multiple compression and sharp intraday pullbacks if sector momentum slows or earnings execution wavers.
This article may include AI-generated content that is human-reviewed, which is for reference and general information purposes only and does not constitute investment advice.
Recommended Articles









Comments (0)
Click the $ button, enter the symbol, and select to link a stock, ETF, or other ticker.