


Pan American Silver Corp Stock (PAAS) Moved Down by 10.27% on Aug 13: Drivers Behind the Movement



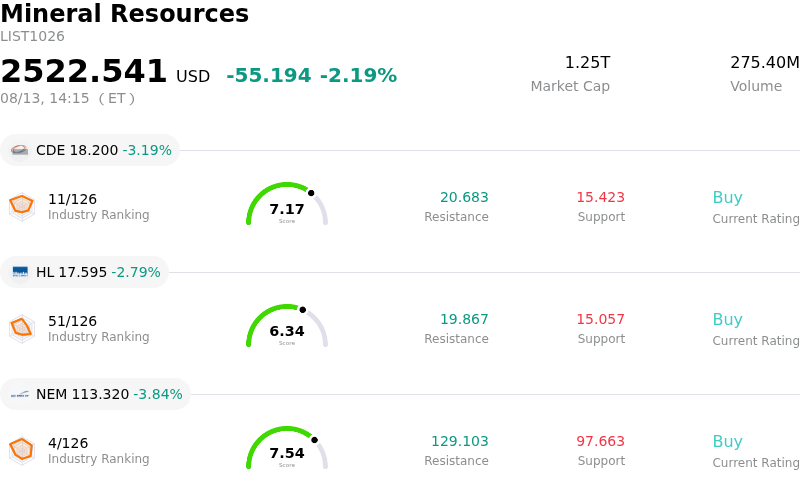
Pan American Silver Corp (PAAS) moved down by 10.27%. The Mineral Resources sector is down by 2.19%. The company underperformed the industry. Top 3 stocks by turnover in the sector: Coeur Mining Inc (CDE) down 3.19%; Hecla Mining Co (HL) down 2.79%; Newmont Corporation (NEM) down 3.84%.
What is driving Pan American Silver Corp (PAAS)’s stock price down today?
Pan American Silver experienced sharp selling pressure following the release of its second-quarter financial results, which missed Wall Street consensus expectations for both top-line revenue and adjusted earnings per share. Although total revenue expanded significantly compared to the prior-year period on the back of elevated precious metal realization prices, reported profits fell short of analyst forecasts, triggering immediate profit-taking and institutional derisking.
A primary driver behind the earnings shortfall was an operational divide between the company's silver and gold segments. While attributable silver output achieved the upper end of quarterly management targets—led by solid performances at core assets like La Colorada and Juanicipio—gold production lagged expectations due to operational adjustments and seismic risk mitigation measures at key sites such as the Jacobina mine in Brazil. Furthermore, gold segment all-in sustaining costs rose above expected annual target ranges, driven by higher consumable expenses, labor cost growth, and price-linked royalty payments.
In addition to operational friction in the gold segment, overall bottom-line profitability was squeezed by a higher effective tax rate and a heavy quarterly tax settlement payment. Management's forward outlook further weighed on market sentiment, as full-year gold production was projected near the bottom of previous guidance ranges while gold segment operating costs were pushed toward the upper threshold. Additionally, management raised its full-year tax guidance due to stronger baseline commodity prices, raising concerns over near-term net income conversion.
Despite these headwind factors, the company demonstrated underlying cash generation, delivering substantial free cash flow and executing record capital returns through quarterly cash dividends and share repurchases. However, market focus remained fixed on margin compression within the gold division, elevated cost structures, and the immediate earnings miss, resulting in significant downward pressure on the equity.
Technical Analysis of Pan American Silver Corp (PAAS)
Technically, Pan American Silver Corp (PAAS) shows a MACD (12,26,9) value of 2.328, indicating a buy signal. The RSI at 70.064 suggests buy condition and the Williams %R at 9.444 suggests overbought condition. Please monitor closely.
Fundamental Analysis of Pan American Silver Corp (PAAS)
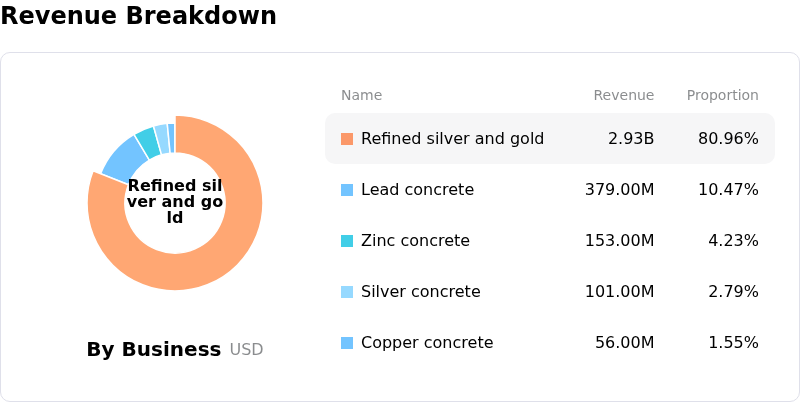
Pan American Silver Corp (PAAS) is in the Mineral Resources industry. Its latest annual revenue is $3.62B, ranking 31 in the industry. The net profit is $978.00M, ranking 19 in the industry. Company Profile
Over the past month, multiple analysts have rated the company as Buy, with an average price target of $67.62, a high of $94.00, and a low of $49.00.
More details about Pan American Silver Corp (PAAS)
Company Specific Risks:
- Q2 2026 Earnings and Revenue Miss: Pan American Silver reported Q2 2026 adjusted earnings per share of $0.73 on $1.12 billion in revenue, missing Wall Street consensus estimates of $0.92 EPS and $1.16 billion in sales, driving an intraday stock drop of nearly 10%.
- Weaker Gold Production and Lowered Output Guidance: Attributable gold production of 165,900 ounces missed quarterly forecasts, hindered by operational adjustments and seismic risk mitigation measures at the Jacobina mine, leading management to narrow full-year 2026 gold output expectations to the low end of its 700,000 to 750,000 ounce target range.
- Cost Inflation in Gold Segment AISC: Gold segment All-In Sustaining Costs (AISC) jumped to $1,984 per ounce in Q2—surpassing quarterly guidance due to elevated consumables, rising labor expenses, and increased royalties—putting full-year gold AISC on track for the high end of its $1,700 to $1,850/oz estimate range.
- Elevated Tax Liabilities Eroding Net Profitability: The company’s effective tax rate jumped to approximately 37% alongside $205 million in Q2 tax payments, driven by final settlement payments for fiscal 2025 liabilities, significantly impacting quarterly net earnings and cash margins.
This article may include AI-generated content that is human-reviewed, which is for reference and general information purposes only and does not constitute investment advice.
Recommended Articles










Comments (0)
Click the $ button, enter the symbol, and select to link a stock, ETF, or other ticker.