


Hewlett Packard Enterprise Co Stock (HPE) Moved Up by 5.28% on Aug 12: Drivers Behind the Movement



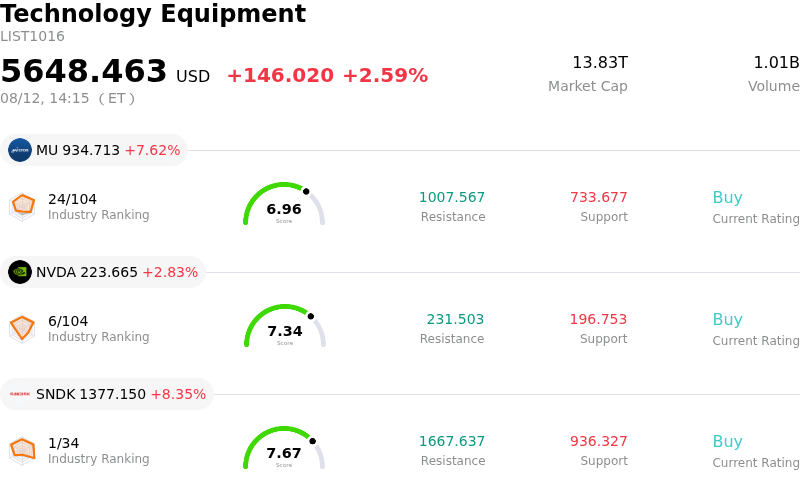
Hewlett Packard Enterprise Co (HPE) moved up by 5.28%. The Technology Equipment sector is up by 2.59%. The company outperformed the industry. Top 3 stocks by turnover in the sector: Micron Technology Inc (MU) up 7.62%; NVIDIA Corp (NVDA) up 2.83%; SanDisk Corporation (SNDK) up 8.35%.
What is driving Hewlett Packard Enterprise Co (HPE)’s stock price up today?
Hewlett Packard Enterprise experienced notable upward momentum driven by strong buying interest across the enterprise artificial intelligence infrastructure sector. Positive momentum in server and data center peer stocks provided a favorable backdrop, as market participants continue to rotate capital into hardware providers powering next-generation workloads. Compounding this sector-wide enthusiasm, recent bullish broker actions, including a key rating upgrade from Wall Street research firms highlighting resilient enterprise infrastructure spending and attractive valuation asymmetry, served as a primary catalyst for the stock's positive price action.
Underlying fundamental strength has further bolstered investor confidence following impressive revenue growth and adjusted earnings expansion in recent quarters. The strategic integration of Juniper Networks has expanded the company's networking footprint and enhanced its competitive position, unlocking higher-margin recurring revenue streams. Management's upwardly revised full-year outlook for top-line growth and server demand reinforces the narrative that enterprise hardware spending remains durable despite broader macroeconomic uncertainties. Furthermore, accelerating free cash flow conversion and disciplined debt reduction efforts have eased balance sheet concerns, giving the equity a solid fundamental backstop.
Market sentiment was additionally supported by recent disclosures showing increased institutional equity accumulation during the second quarter. Value-oriented investors and hedge funds appear to be capitalizing on discount-to-intrinsic-value projections and favorable forward price-to-earnings multiples relative to tech peers. While intraday volatility remains present amid lingering questions around deal synergy execution and broader macroeconomic spending trends, the convergence of robust AI server demand, analyst price target increases, and steady institutional inflows continues to tilt short-term price dynamics in favor of buyers.
Technical Analysis of Hewlett Packard Enterprise Co (HPE)
Technically, Hewlett Packard Enterprise Co (HPE) shows a MACD (12,26,9) value of 1.310, indicating a buy signal. The RSI at 65.503 suggests neutral condition and the Williams %R at 15.825 suggests overbought condition. Please monitor closely.
Media Coverage of Hewlett Packard Enterprise Co (HPE)
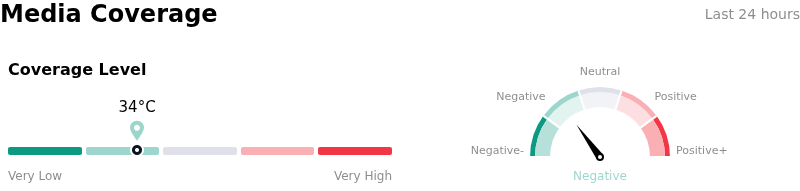
In terms of media coverage, Hewlett Packard Enterprise Co (HPE) shows a coverage score of 34, indicating a low level of media attention. The overall market sentiment index is currently in bearish zone.
Fundamental Analysis of Hewlett Packard Enterprise Co (HPE)
Hewlett Packard Enterprise Co (HPE) is in the Technology Equipment industry. Its latest annual revenue is $34.30B, ranking 7 in the industry. The net profit is $-59.00M, ranking 36 in the industry. Company Profile
Over the past month, multiple analysts have rated the company as Buy, with an average price target of $67.72, a high of $80.00, and a low of $52.00.
More details about Hewlett Packard Enterprise Co (HPE)
Company Specific Risks:
- Elevated Earnings-Based Valuation Multiples: Valuation analysis indicates HPE trades at a trailing price-to-earnings ratio near 50x, well above the broader technology sector average, exposing the stock to sharp intraday downside if operational performance fails to justify current premium multiples.
- Component Cost Inflation and Margin Squeeze: Surging DRAM and NAND memory prices alongside rising freight costs threaten gross margin sustainability in HPE's high-density server and compute business, counteracting volume growth in enterprise hardware.
- Juniper Networks Integration and Execution Risk: Absorbing and scaling the Juniper Networks acquisition introduces structural integration complexity, debt service overhead, and potential friction in achieving projected operational synergies across the networking segment.
- AI Infrastructure Deployment Delays: Enterprise revenue remains highly sensitive to customer site bottlenecks in power, cooling, and network readiness, creating risk of quarter-to-quarter order deferrals ahead of HPE's upcoming fiscal third-quarter earnings release.
This article may include AI-generated content that is human-reviewed, which is for reference and general information purposes only and does not constitute investment advice.
Recommended Articles









Comments (0)
Click the $ button, enter the symbol, and select to link a stock, ETF, or other ticker.