

Texas Instruments Inc Stock (TXN) Moved Down by 5.12% on Jun 5: Key Drivers Unveiled

Texas Instruments Inc (TXN) moved down by 5.12%. The Technology Equipment sector is down by 4.16%. The company underperformed the industry. Top 3 stocks by turnover in the sector: Micron Technology Inc (MU) down 6.67%; NVIDIA Corp (NVDA) down 4.28%; Marvell Technology Inc (MRVL) down 7.98%.

What is driving Texas Instruments Inc (TXN)’s stock price down today?
The significant intraday decline in Texas Instruments' stock reflects a broader downturn sweeping across the semiconductor sector today. This sector-wide selling pressure appears to be a reaction to recent industry reports and a general re-evaluation of technology stock valuations. Following a period of substantial growth and strong performance, investors are exhibiting increased selectivity within the artificial intelligence and semiconductor space, leading to profit-taking and a rotation away from these previously high-flying segments.
This movement is occurring despite Texas Instruments' recent positive financial indicators and optimistic outlook. The company previously delivered strong first-quarter results and provided robust guidance for the second quarter, driven by accelerating demand in industrial and data center markets. However, the current market sentiment is overshadowing these positive company-specific fundamentals.
Adding to the cautious mood, some analyst assessments suggest the stock may be appearing overvalued relative to its fair value, despite a consensus "Hold" rating from a broad group of analysts. Furthermore, recent insider selling activity, including a notable transaction by the Chief Executive Officer, could be interpreted by the market as a signal from within the company that current valuation levels may be stretched. Therefore, while the company maintains a solid position and growth prospects, today's share price movement is primarily influenced by the prevailing negative sentiment and correction within the wider semiconductor industry.
Technical Analysis of Texas Instruments Inc (TXN)
Technically, Texas Instruments Inc (TXN) shows a MACD (12,26,9) value of [15.19], indicating a neutral signal. The RSI at 57.75 suggests neutral condition and the Williams %R at -62.87 suggests oversold condition. Please monitor closely.
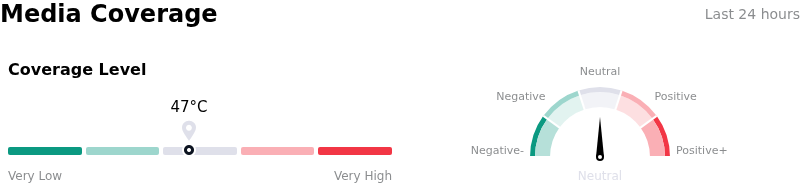
Media Coverage of Texas Instruments Inc (TXN)
In terms of media coverage, Texas Instruments Inc (TXN) shows a coverage score of 47, indicating a moderate level of media attention. The overall market sentiment index is currently in neutral zone.
Fundamental Analysis of Texas Instruments Inc (TXN)
Texas Instruments Inc (TXN) is in the Technology Equipment industry. Its latest annual revenue is $17.68B, ranking 13 in the industry. The net profit is $4.97B, ranking 9 in the industry. Company Profile
Over the past month, multiple analysts have rated the company as Hold, with an average price target of $280.14, a high of $400.00, and a low of $184.59.
More details about Texas Instruments Inc (TXN)
Company Specific Risks:
- The company's stock currently trades at an elevated forward P/E ratio of 40.26, indicating high market expectations and making it susceptible to significant corrections if future earnings or growth guidance fall short of these expectations.
- Texas Instruments' stock has underperformed the broader Computer and Technology sector over the last month, suggesting a potential lack of strong catalysts or increased vulnerability to sector-wide pullbacks compared to its peers.
- A significant 75% of Texas Instruments' 2025 revenue was concentrated in the industrial and automotive markets, leaving the company exposed to potential cyclical downturns or specific demand fluctuations within these sectors.
This article may include AI-generated content that is human-reviewed, which is for reference and general information purposes only and does not constitute investment advice.
Recommended Articles


Comments (0)
Click the $ button, enter the symbol, and select to link a stock, ETF, or other ticker.