


Cardano Price Forecast: On-chain and derivatives weakness point to further ADA downside



- Cardano extends its decline, trading below $0.169 on Friday, with losses nearing 4% so far this week.
- Weakening derivatives metrics and bearish on-chain indicators support the ongoing correction.
- The deteriorating technical outlook suggests further downside risks for ADA.
Cardano (ADA) extends losses, trading below $0.169 on Friday, with losses nearing 4% so far this week. Moreover, ADA is heading into its sixth consecutive weekly correction, down more than 30% since early October. Weakening derivatives metrics and bearish on-chain indicators point to declining market participation, while the technical outlook suggests further downside risks as sellers maintain control.
Derivatives data shows bearish bias
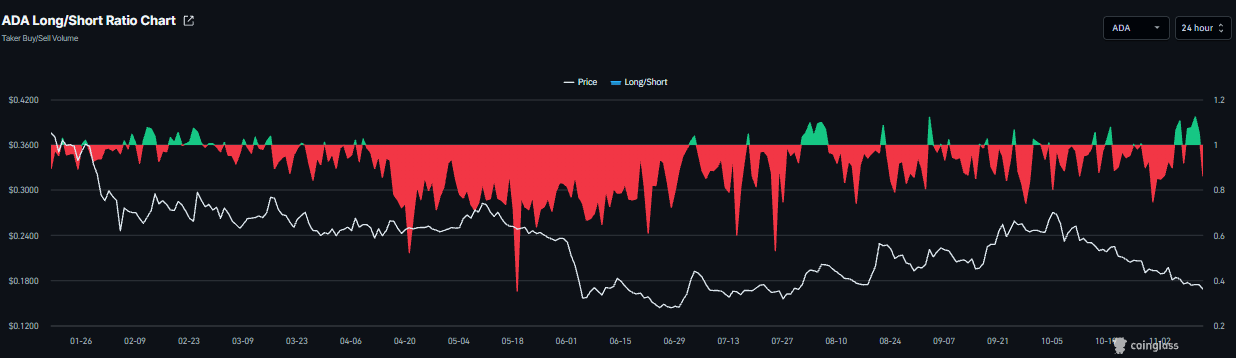
Derivatives data shows a bearish bias for Cardano. CoinGlass’ long-to-short ratio for ADA reads 0.86 on Monday, nearing the lowest level over a month. A ratio below one indicates bearish sentiment, as traders bet that asset prices will fall.
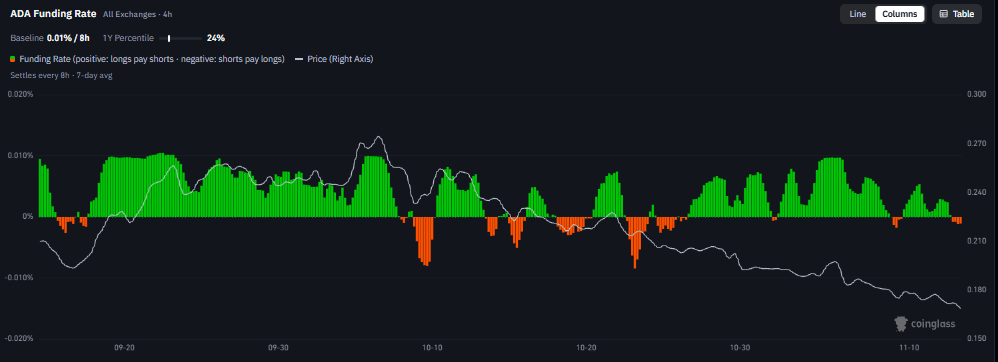
In addition, Cardano’s funding rate flipped negative on Thursday and reads -0.0015% on Friday, indicating shorts are paying longs and suggesting a bearish outlook.
On-chain metrics show cautionary signs
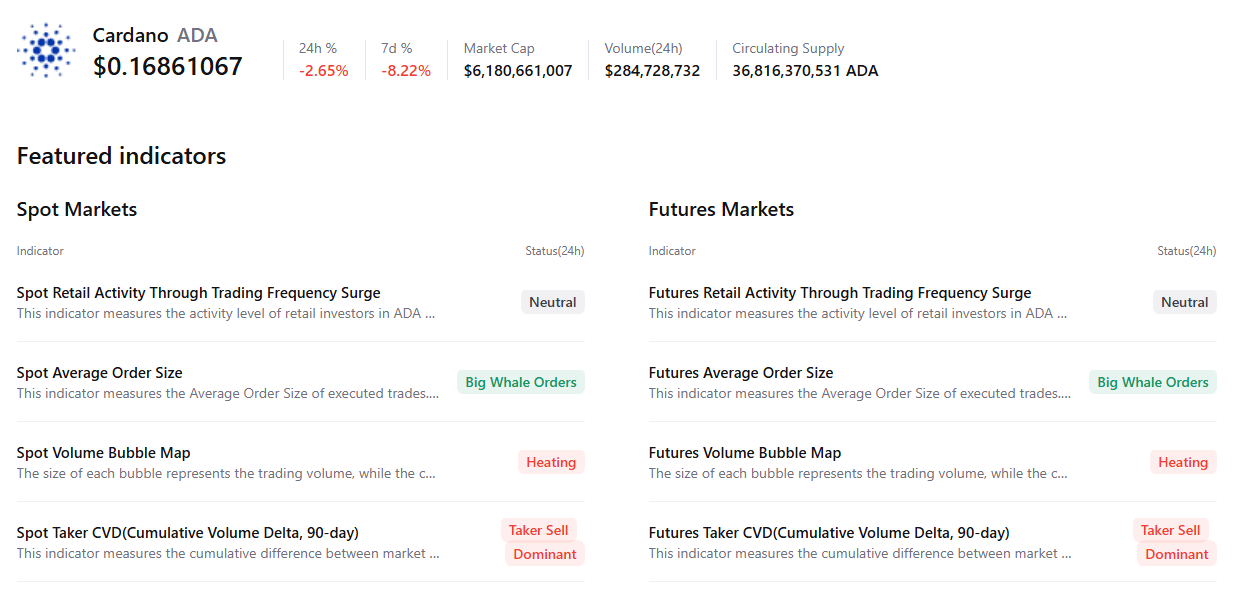
CryptoQuant’s summary data shows a cautious outlook for Cardano. ADA’s spot and futures markets show large whale orders alongside heating conditions. Both markets also show sell-side dominance. These highlight a bearish, cautious sentiment bias among ADA traders.
Cardano technical outlook: Bears to push ADA lower
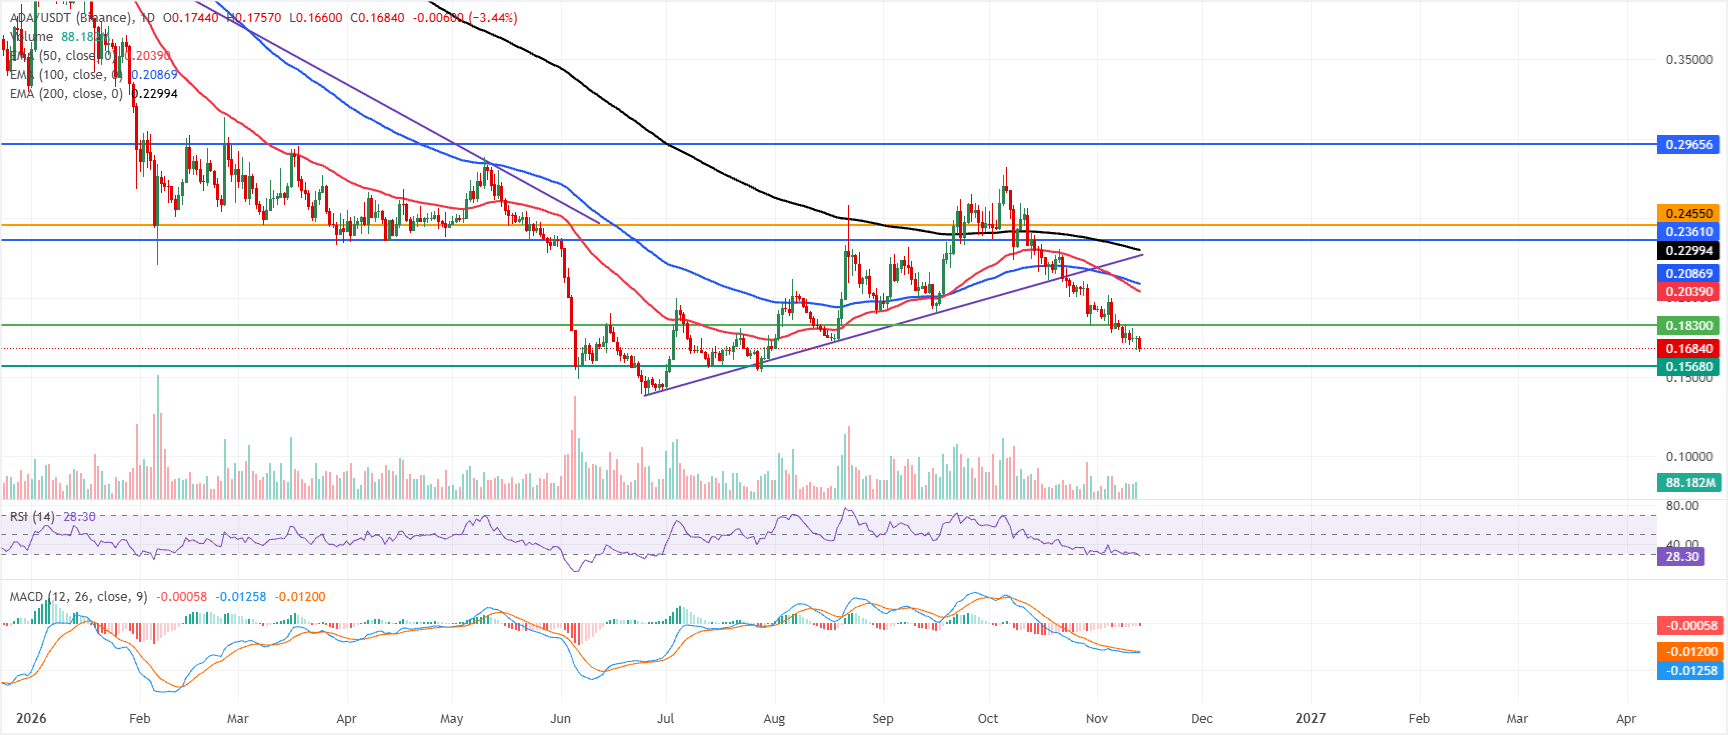
Cardano price trades at $0.168 on Friday, holding a bearish near-term bias as it remains decisively below the 50-day, 100-day and 200-day Exponential Moving Averages (EMAs) at $0.203, $0.208 and $0.229, respectively.
Momentum remains weak, with the Relative Strength Index (RSI) slipping toward oversold territory near 28. Meanwhile, the Moving Average Convergence Divergence (MACD) indicator stays negative with a flat histogram, suggesting persistent downside pressure rather than an imminent reversal.
On the topside, initial resistance appears at the horizontal barrier near $0.183, ahead of a dense EMA cluster between $0.203 and $0.229, while higher resistances are seen at $0.236, $0.245 and $0.296.
On the downside, the next notable support is the horizontal floor at $0.156, and a clear break beneath this level would expose additional selling risk within the prevailing downtrend.
(The technical analysis of this story was written with the help of an AI tool. Know more.)
Recommended Articles









Comments (0)
Click the $ button, enter the symbol, and select to link a stock, ETF, or other ticker.